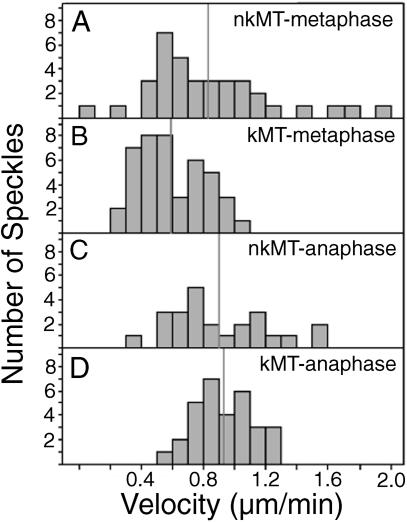
Figure 4.
Summary of data obtained from manual tracking of speckles in metaphase and anaphase spindles. Histograms of speckle velocities exhibited by (A) nonkinetochore microtubules in metaphase spindles, (B) kinetochore microtubules in metaphase spindles, (C) nonkinetochore microtubules in anaphase spindles, and (D) kinetochore microtubules in anaphase spindles. Mean velocities are indicated with vertical gray lines.

