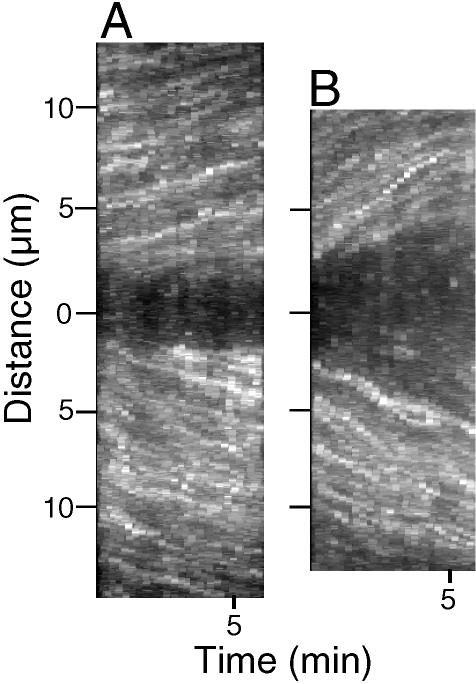
Figure 5.
3-D projections made using the same kinetochore fibers at metaphase and anaphase. (A) 3-D projection made using a 24-frame image stack (15-s intervals between frames) of a spermatocyte at metaphase ∼40 min after a 2-s pulse injection of rh-tubulin. (B) 3-D projection of the same pair of kinetochore fibers projected in A using a 24-frame image stack made during anaphase A, when flux rates within kinetochore fibers are faster than at metaphase; slopes of speckle tracks in the projections of anaphase fibers (B) are steeper than tracks at metaphase (A).

