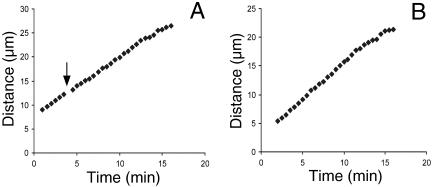
Figure 6.
Distance vs. time plots of spatial separation of half-bivalent kinetochores during anaphase A yield linear velocity profiles. (A) A plot for partner half-bivalents in a spermatocyte that was injected with ∼500 fl of 30 μM rh-tubulin during anaphase (arrow indicates the time of injection). (B) A similar plot of velocity of chromosome separation for a pair of half-bivalents in a control (not injected) cell.

