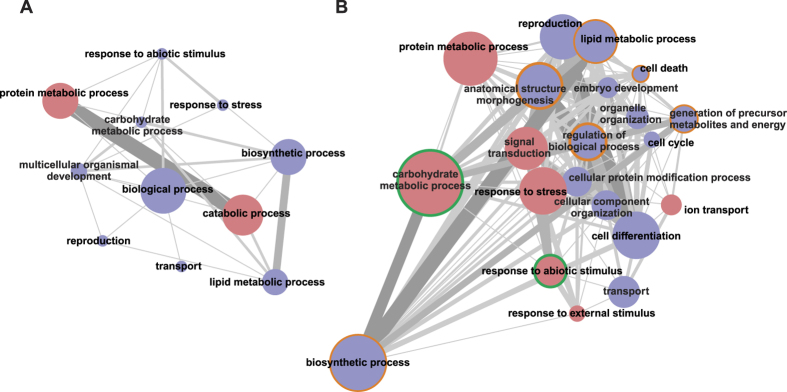
Figure 3.
Gene set analysis of the biological processes coded by the differentially expressed genes in B. oleae larvae feeding on green olives, (A) compared to larvae reared on artificial diet and (B) black olives (log2FC > 1 and adjusted p-value < 0.05). Gene sets with gene members between 5 and 30 were used for analysis. Nodes and interconnecting lines represent gene sets and the inter-set overlap, respectively. Using larvae fed on artificial diet or black olives as the reference, blue and red node colors indicate that the gene members were under and over-expressed in the larvae feeding on green olives, respectively. The significantly enriched gene sets are indicated by an orange halo (BH-adjusted p-value < 0.05, obtained through piano) analysis and a green halo (Fisher’s exact test, BH-adjusted p-value < 0.05, obtained through Blast2GO analysis). The number of genes on the interconnecting lines ranged from 1 to 9 and 1 to 13 in panel A and panel B, respectively. Gene sets are named by their descriptive labels. The gene set map and directionality of differential expression was produced using the piano package66. For more a detailed list of GO-enriched terms, see Table S4.

