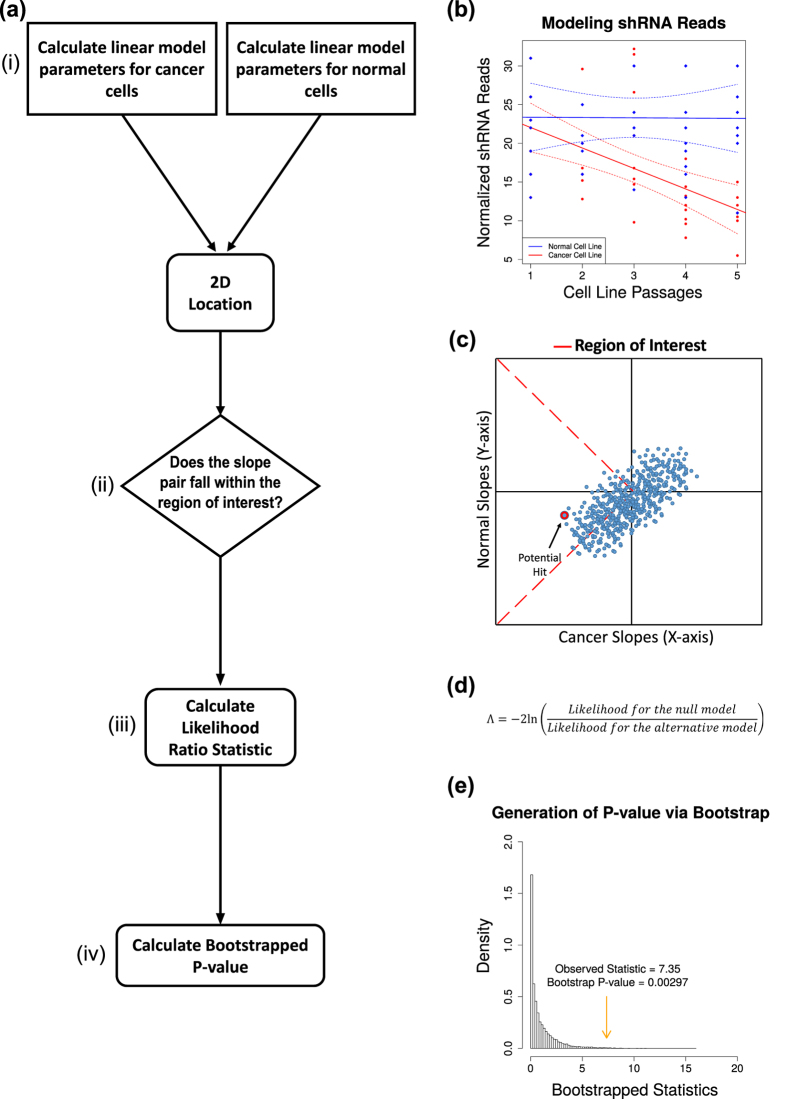
Figure 2. Statistical analysis of shRNA depletion over multiple passages.
(a) The analysis of shRNA reads over multiple passages was performed by (i) calculating the linear regression model for the cancer cell line of interest and the normal cell line. (ii) shRNAs whose regression parameters fall within the region of interest were then identified. (iii) The likelihood ratio test statistic was calculated for shRNAs within the region of interest. (iv) A P-value for the likelihood ratio test statistic was then calculated via a bootstrap method. (b) A representation of the linear regression model calculated for all shRNAs targeting a single gene over five cell line passages for cancer (red) and normal (blue) cells. (c) The region of interest (demarcated in red) was defined by depletion of shRNA reads in cancer cell lines (x-axis) and less extreme depletion or enrichment in normal cells (y-axis). (d) The likelihood ratio test statistic for genes within the region of interest was the −2ln of the likelihood of the regression parameters being located outside the region of interest (null model) over the likelihood that the regression parameters were within the region of interest (alternative model). (e) A P-value for the observed likelihood ratio statistic, for a given target gene, was calculated as the probability of observing a value at least as large as the observed value out of 10,000 residual re-sampling bootstraps.

