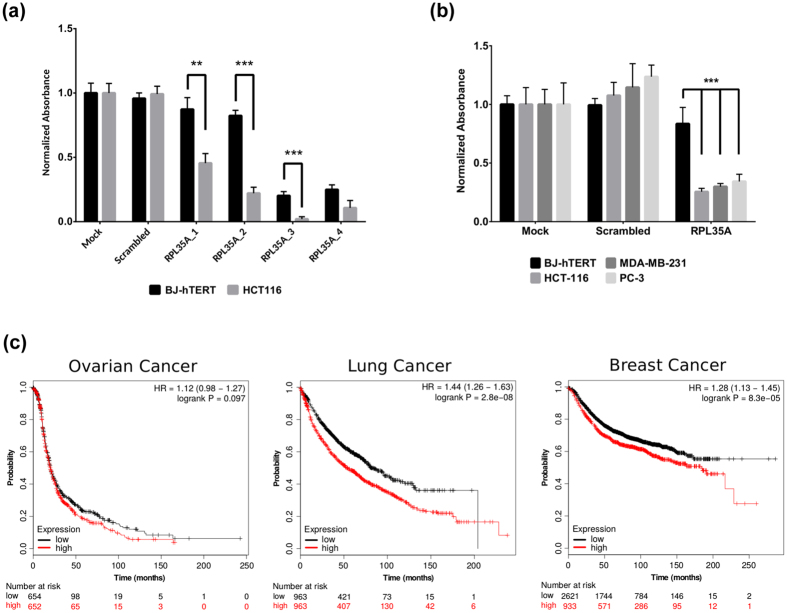
Figure 3. RPL35A depletion significantly reduces cancer cell growth compared to normal cells.
(a) BJ-hTERT and HCT116 cells were transfected with four individual siRNAs, 5 nM each (Qiagen). The number of cells was quantified 5 days after transfection using SRB assay. Bars represent mean normalized absorbance at 540 nm +/− 1 SD (P-values: 0.0035, 7.6356e-05, 0.0009, N.S.). P-values were calculated using single tailed Welch’s t-test. (b) BJ-hTERT, HCT116, MDA-MB-231, and PC-3 cell lines were transfected with 2.5 nM of pooled siRNAs (GE Healthcare). Cell number determined and represented as in (a) (P-values: all <0.0001). Significance calculated as above but with additional Holm-Sidak correction for multiple testing. All siRNA transfections presented on panel A and B performed in 4 replicates. (c) Association of RPL35A expression in Affimetrix array datasets with survival of ovarian, breast, and lung cancer patients was analyzed using KM-plotter70. Plots represent survival of patients with high (red) and low (black) level of RPL35A expression.

