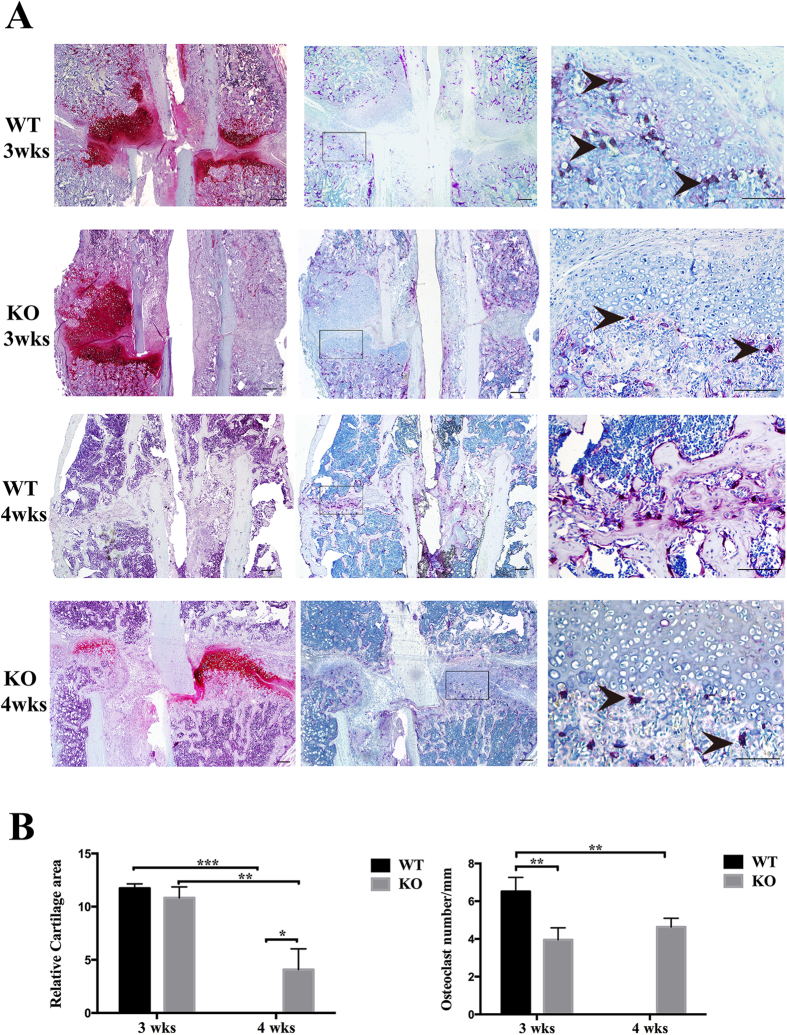
Figure 3. TRPV1 knockout decreased the number of TRAP-positive cells and inhibited cartilage dissolution.
(A) The left four pictures are safranin O stained and showed the red color cartilage (bar = 200 μm). The middle four (bar = 200 μm) and right four (bar = 100 μm) pictures are TRAP stained. The right four pictures show magnified views of the black frames in the middle pictures. The 4 weeks post-fracture WT group showed that the cartilage had been removed and exhibited hard callus remodeling. The black arrowhead showed TRAP-positive osteoclasts at the cartilage-bone boundary (WT: wild-type group, KO: knockout group). (B) The left graph is the quantification of the relative cartilage area. The right graph is the quantification of the number of TRAP-positive cells (*p < 0.05, **p < 0.01, and ***p < 0.001). note: the osteoclasts were quantified near the cartilage-bone boundary and the and the osteoclast in the bone marrow and hard-callus were not include in this study.

