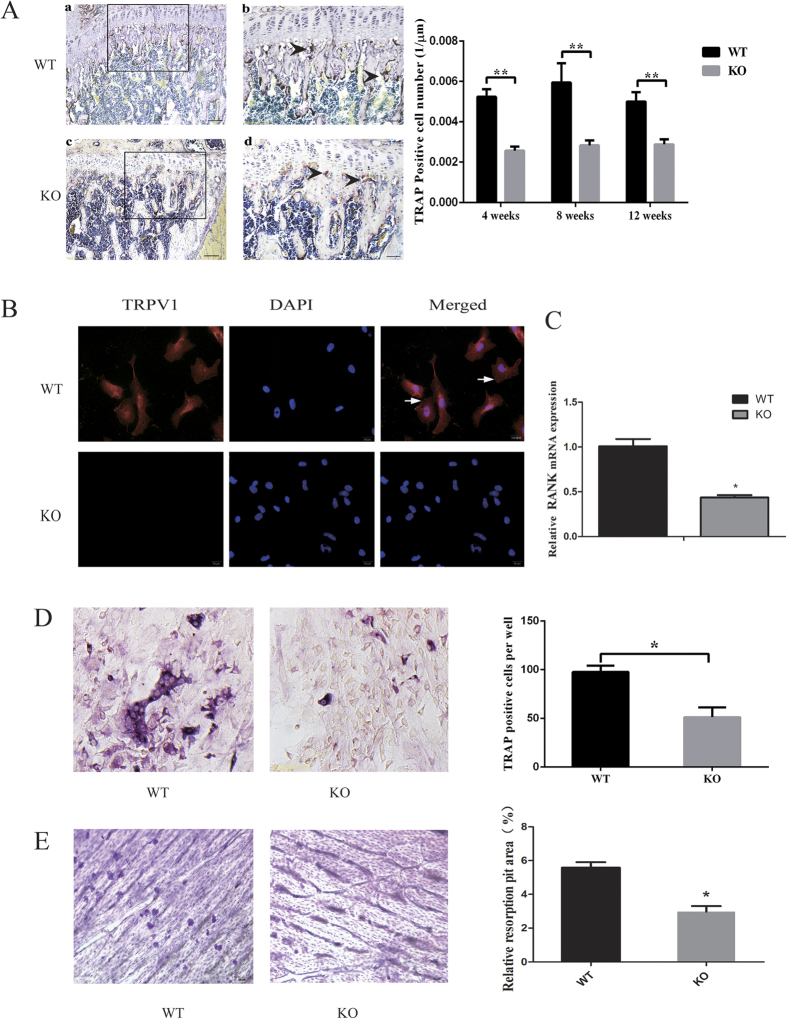
Figure 4. TRPV1 knockout impaired osteoclastogenesis in vivo and in vitro.
(A) TRAP staining. The left images show that the knockout group had fewer TRAP-positive cells at 8 weeks compared with the wild-type group. Figure Ab,d show a magnified view of the black frames in Fig. Aa,c, respectively, and the black arrowheads showed the TRAP-positive osteoclasts (bar = 200 μm in Fig. Ca,c; bar = 100 μm in Fig. Ab,d). The right graph shows the quantification of TRAP-positive cells per length. (B) The cell immunofluorescence images showed that TRPV1 was expressed in WT osteoclast precursors but not in those from the TRPV1 KO group. (C) RANK mRNA expression in the TRPV1 knockout group and WT group by real-time PCR assays. (D) The left images show that the TRPV1 knockout group has fewer TRAP-positive cells in vitro (bar = 50 μm). The right graph shows the qualification of TRAP-positive cell number after in vitro osteoclastogenic induction. (E) The left images showed that WT osteoclasts formed more resorption pits on the bone slice than those from the TRPV1 KO group. The right graph shows the quantification of the relative resorption area (*p < 0.05, **p < 0.01).

