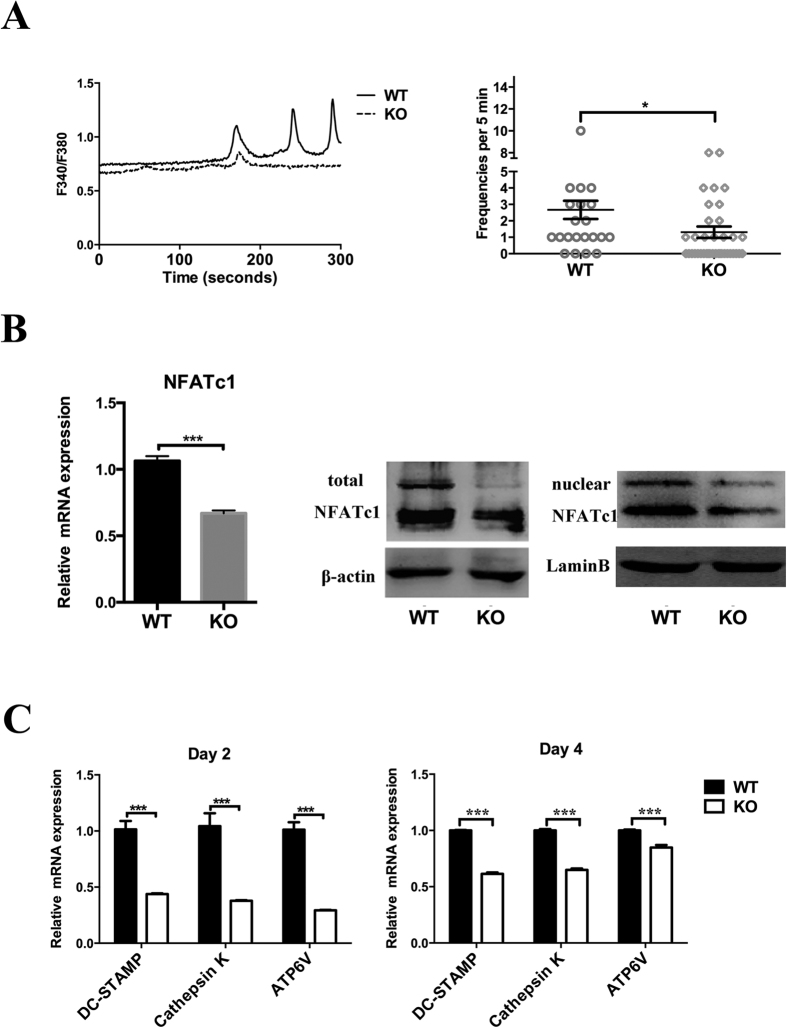
Figure 5. TRPV1 knockout inhibits calcium signal downstream NFATc1.
(A) The left graph shows the time course of the calcium oscillations of both groups. The right graph shows the summary of all the calculated cells of both groups. (B) The left graph shows the real-time PCR results from BMMs induced to osteoclastogenesis for 2 days. The right images show western blots of total and nuclear NFATc1. (C) Real-time PCR results show the NFATc1 target genes DC stamp, cathepsin K, and ATP6V mRNA expression (*p < 0.05 and ***p < 0.001; WT: wild-type group, KO: knockout group).

