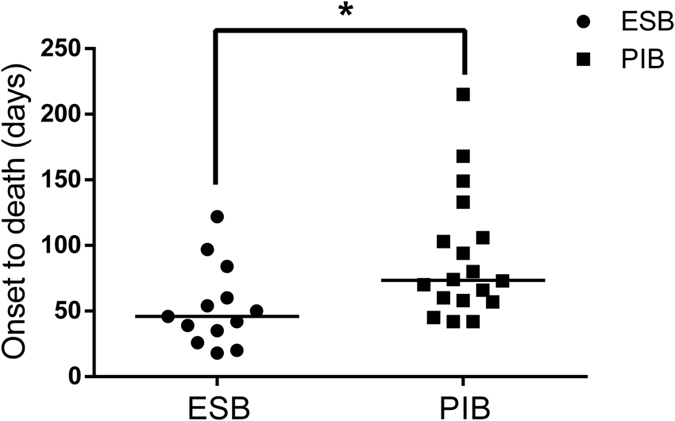
Figure 2. Distribution of survival time between ESB group and PIB group (Mann–Whitney U-test).

The lines in the figure refer to the median survival time of patients (ESB group: 46[30.5–72] days vs PIB group: 73.5[57.75–112.75] days, P = 0.010).

The lines in the figure refer to the median survival time of patients (ESB group: 46[30.5–72] days vs PIB group: 73.5[57.75–112.75] days, P = 0.010).