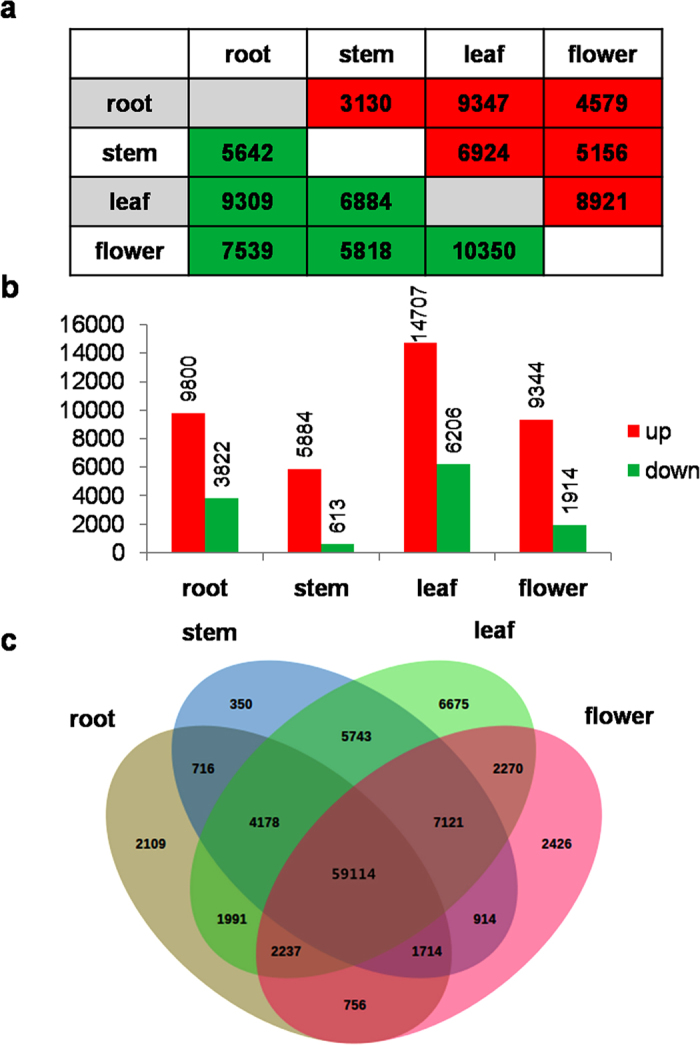
Figure 6. Differential expression analysis of S. mussotii transcripts.

(a) Pair-wise comparisons of different tissues showing DETs. (b) The number of significantly (P-value ≤ 0.05 and at least two-fold change) up- and down- regulated transcripts in each tissue as compared to all three other tissues. (c) Venn diagram representing the number of DETs among S. mussotii tissues.
