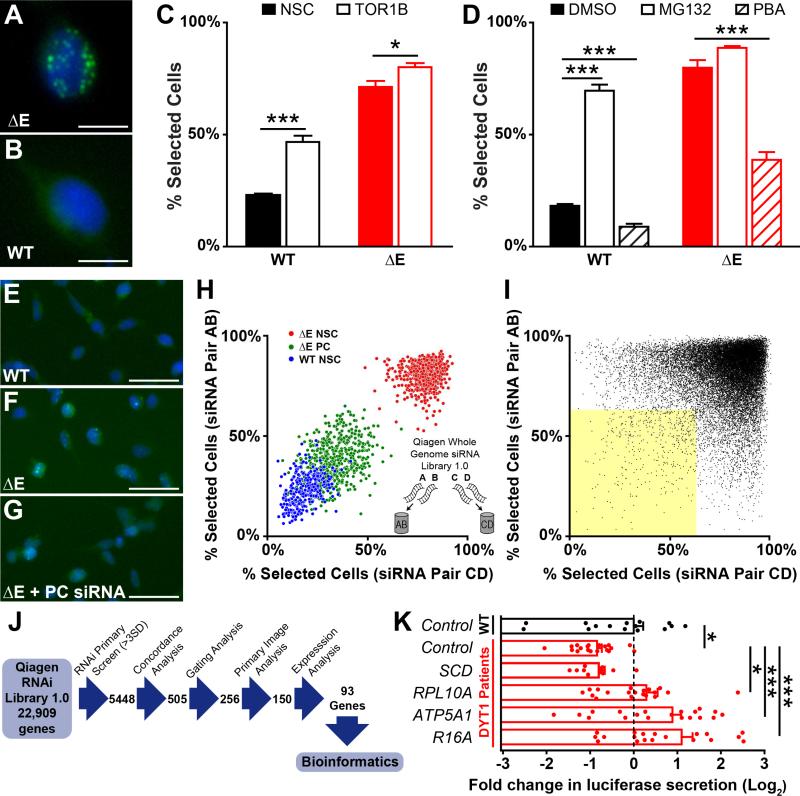
Figure 1. Torsin1a mislocalization assay and genome-wide siRNA screen.
(A and B) Flp-In T-REx 293T stable cell lines expressing ΔE (A) and WT (B) EGFP-hTorsin1a following 72 h tetracycline induction. Green – EGFP-hTorsin1a. Blue – Hoescht nuclear stain. Scale bars = 10 μm.
(C) Percent of cells with ≥ 1 EGFP puncta (“Percent Selected Cells” – see Figure S2) after siRNA silencing of Torsin1b. n = 16 wells for control siRNA and 32 wells for TOR1B siRNAs.
(D) Percent of cells with ≥ 1 EGFP puncta after treatment with the protesome inhibitor MG132 (10 μM) or the chemical chaperone phenylbutyric acid (PBA, 20 mM). n = 4 DMSO-treated wells and 8 MG132/PBA-treated wells.
(E-G) Cell lines under high-throughput screening conditions after transfection with non-silencing control siRNA (E and F) or positive control siRNA (PC, panel G). Scale bars = 50 μm.
(H) Whole genome siRNA (WGS) screen controls and siRNA pooling strategy. Inset – Four independent siRNAs targeting each gene were split into two unique pools of two siRNAs.
(I) Results of WGS screen. Dots represent data for individual gene targets, with results from independent siRNA pools plotted on orthogonal axes. Yellow shaded area – genes with concordant >3SD normalizing effects.
(J) Schematic depicting WGS workflow for analyzing primary hits.
(K) Luciferase secretion in DYT1 patient-derived fibroblasts after lentiviral delivery of shRNAs targeting 4 top WGS hits. n = 4 DYT1 lines and 3 control lines, 5 independent replicates each (except SCD – 3 replicates). *, p < 0.05; ***, p < 0.0005 by unpaired t test. All data are presented as means ± S.E.M.

