Figure 8.
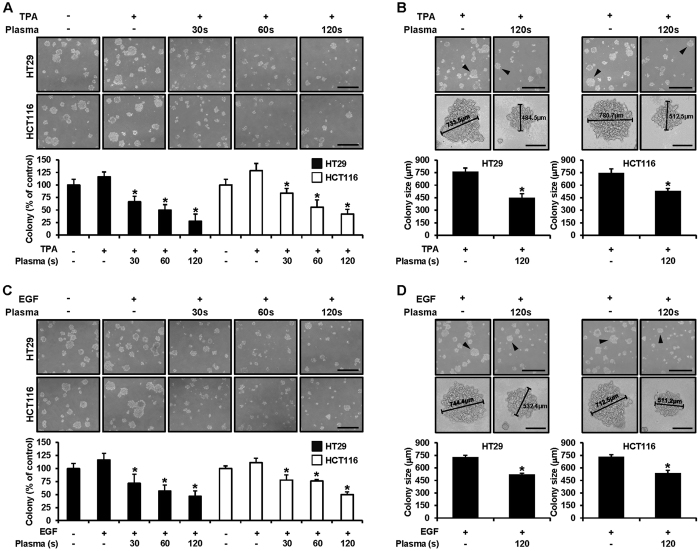
(A,B) HT29 and HCT116 cells were treated with tetradecanoyl phorbol acetate (TPA) and plasma (for 30, 60, and 120 sec) in 1 mL of 0.3% basal Eagle’s medium containing 10% FBS for the anchorage-independent cell transformation assay. Both types of cells were incubated at 37 °C in a 5% CO2 incubator for 14 days, and the number of colonies was counted. Colony counts and sizes are expressed as means ± SD (n = 3; *p < 0.05 vs. control cells), scale bar = 400 μm. (C,D) HT29 and HCT116 cells were treated with epidermal growth factor (EGF) and plasma (for 30, 60, and 120 sec) in 1 mL of 0.3% basal Eagle’s medium containing 10% FBS for the anchorage-independent cell transformation assay. Both types of cells were incubated at 37 °C in a 5% CO2 incubator for 14 days, and the number of colonies was counted. Colony counts and sizes are expressed as means ± SD (n = 3; *p < 0.05 vs. control cells).

