
Figure 4. AOM 2, 3–Relationship among tumor number and mean wheel running distance during the final weeks of wheel access in female A/J mice.
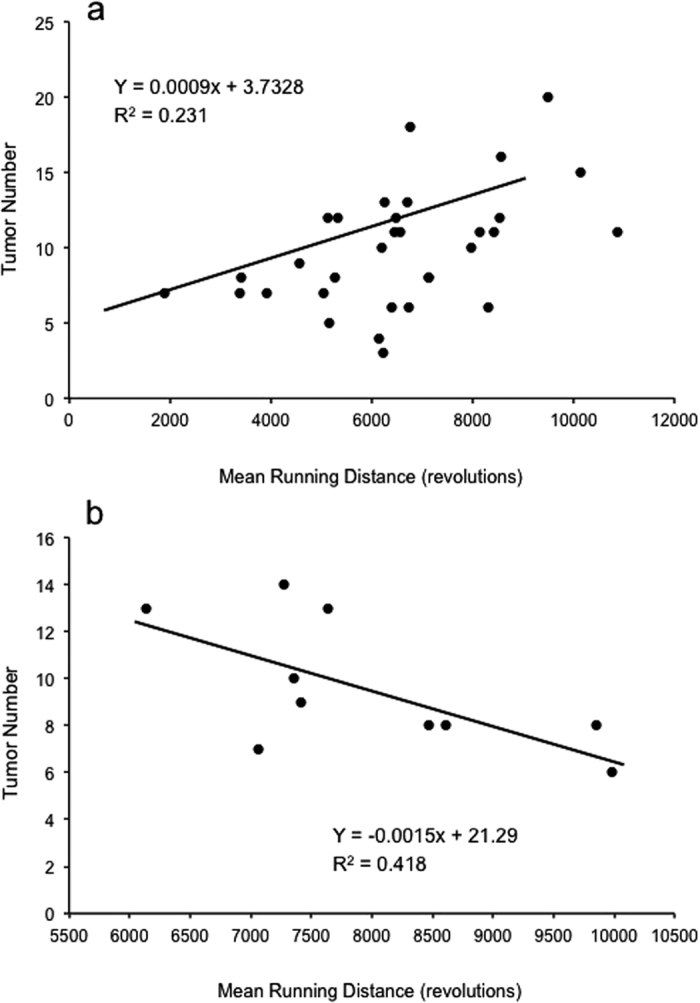
For AOM 2 (a), regression analysis revealed mean wheel running distance explained a significant proportion of the variance in tumor number across all three wheel access groups [5 weeks prior to azoxymethane (AOM) injections, 5 weeks during AOM injections, 10 weeks of wheel access spanning the 5 weeks prior and 5 weeks during AOM] (R = 0.480, R2 = 0.231, P = 0.005). For AOM 3 (b), relationship among tumor number and mean wheel running distance during the final weeks of wheel access in female A/J mice with 5 weeks of wheel access prior to azoxymethane (AOM) injections. Regression analysis revealed mean wheel running distance explained a significant proportion of the variance in tumor number (R = −0.646, R2 = 0.418, P = 0.044).