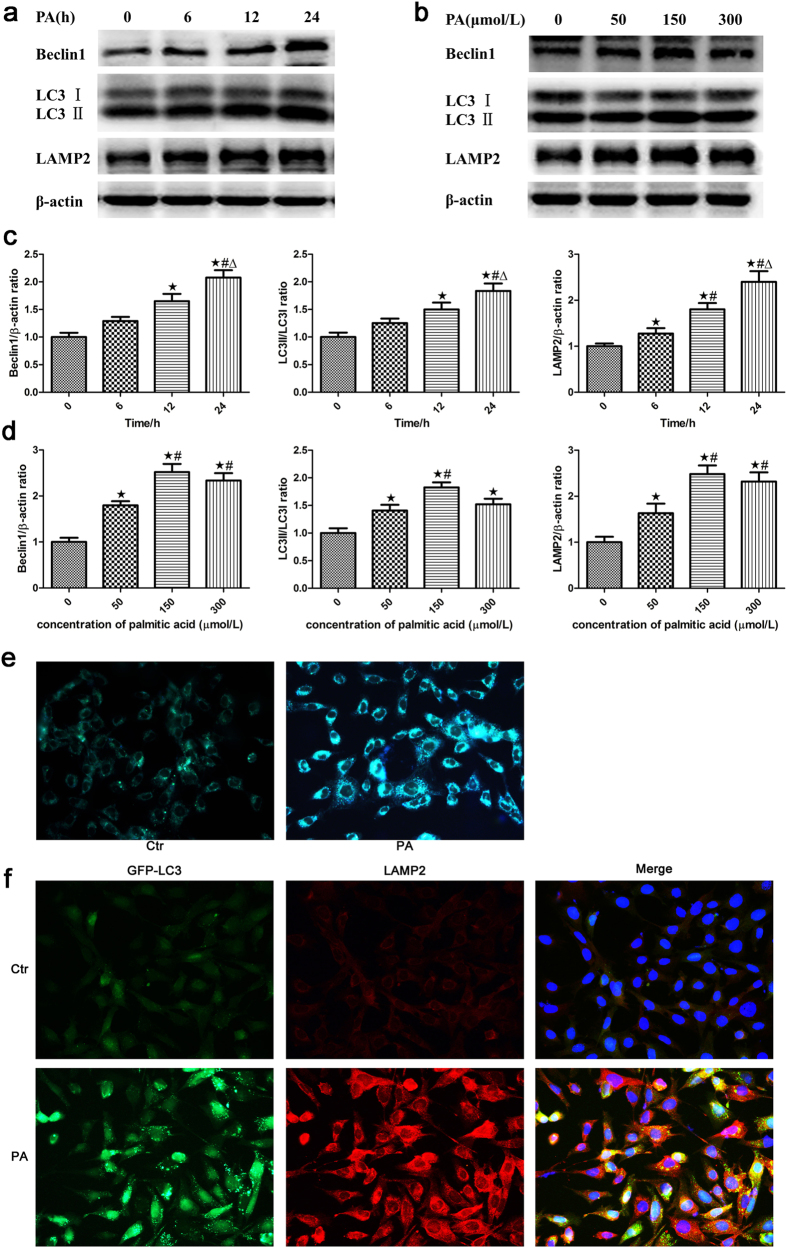
Figure 1. Palmitic acid induced autophagy in podocytes.
(a) Representative Western blot analyses of Beclin1, LC3-II/LC3-I and LAMP-2 expression in podocytes treated with 150 μmol/L palmitic acid at different time points. (b) Representative Western blot analyses of Beclin1, LC3-II/LC3-I and LAMP-2 expression in podocytes treated with different concentrations of palmitic acid for 24 hours. (c,d) Densitometric analysis of Beclin1, LC3-II/LC3-I and LAMP-2 expression in Figure a and b, respectively. The data are represented as the mean ± SEM from at least 3 independent experiments. ∗p < 0.05 vs. 0 h, #p < 0.05 vs. 6 h, Δ p < 0.05 vs. 12 h (c). ∗p < 0.05 vs. 0 μmol/L, #p < 0.05 vs. 50 μmol/L (d). (e) Podocytes were treated with 150 μmol/L palmitic acid for 24 hours and then incubated with monodansylcadaverine (MDC) for 15 min. The cells were washed and examined under a fluorescence microscope (400×). (f) Podocytes stably expressing GFP-LC3 were treated with 150 μmol/L palmitic acid for 24 hours and then stained with an antibody against LAMP-2. Representative images of the cells were taken with a fluorescence microscope (400×). Ctr: Control group, podocytes were treated with 1% bovine serum albumin (BSA); PA: Palmitic acid group, podocytes were treated with 150 μmol/L palmitic acid for 24 hours.

