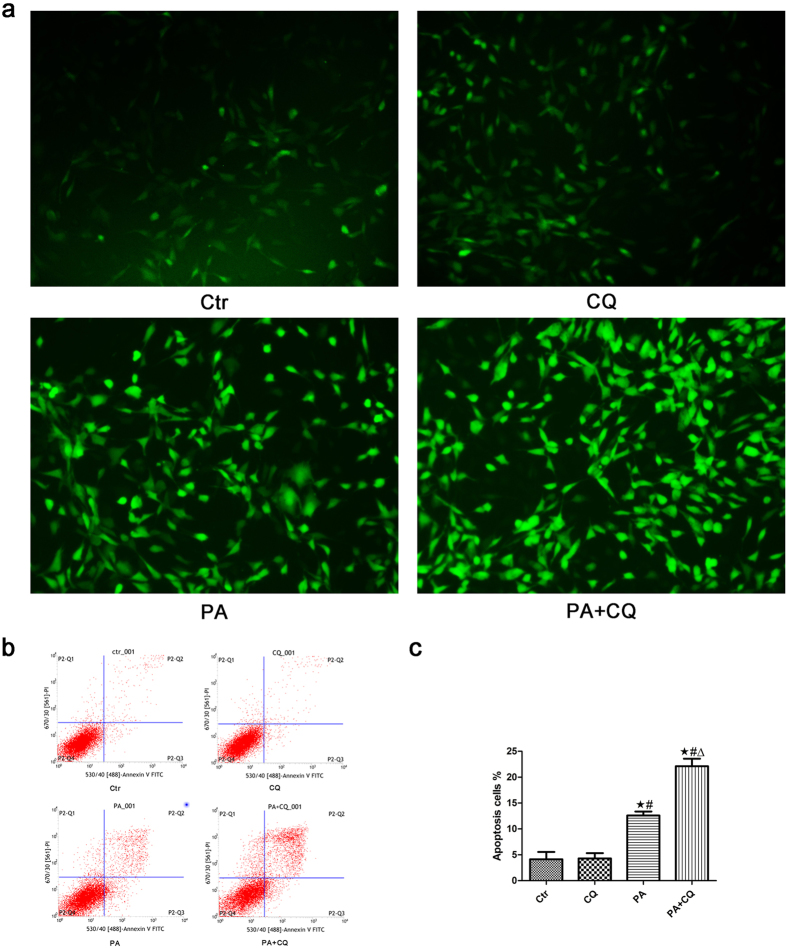
Figure 6. Inhibition of autophagy increased PA-induced ROS generation and apoptosis in podocytes.
(a) Representative immunofluorescence images of ROS in podocytes (200×). Podocytes were treated with 150 μmol/L palmitic acid in the absence or presence of 3 μmol/L chloroquine (CQ) for 24 hours, and the intracellular ROS level was then measured using the fluorescent probe 2′,7′-dichlorfluorescein-diacetate (DCFH-DA). (b,c) Podocytes were treated with 150 μmol/L palmitic acid in the absence or presence of 3 μmol/L CQ for 24 hours, and apoptosis was measured using flow cytometry analysis. (b) Representative cytograms. (c) Percentage of apoptotic cells. ∗p < 0.05 vs. control group, #p < 0.05 vs. CQ group, Δp < 0.05 vs. PA group. Ctr: Control group, podocytes were treated with 1% BSA. CQ: Podocytes were treated with 3 μmol/L chloroquine for 24 hours. PA: Palmitic acid group, podocytes were treated with 150 μmol/L palmitic acid for 24 hours. PA + CQ: Podocytes were treated with 150 μmol/L of palmitic acid for 24 hours after pretreatment with 3 μmol/L chloroquine for 1 hour.

