Figure 2.
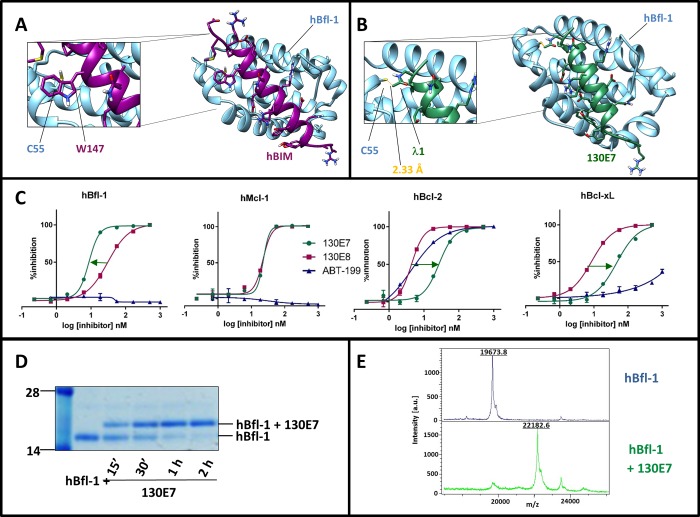
Characterization of covalent hBIM derived peptides. Panel A: Structure of hBfl-1 in complex with hBIM (PDB ID: 2VM6). The close-up view shows the presence of a Trp residue in hBIM (Trp 147) that corresponds to Cys 25 in hNOXA (see Figure 1). hBfl-1 is represented by light-blue ribbons, while hBIM peptide is represented by purple sticks and ribbons. Panel B: Structure of the complex between hBfl-1 and a covalent hBIM derived peptide named 130E7 (Table 1) with a close-up view of the covalent bond between the Cys 55 of hBfl-1 and the Dap-2-chloroacetamide in 130E7 modeled on the hBIM BH3 peptide from the PDB ID 2VM6. The newly formed bond is colored in orange, while hBfl-1 is represented by light blue ribbons and 130E7 is depicted as green sticks and ribbons. Panel C: Dose–response DELFIA curves for the displacement of a BID peptide from the Bcl-2 family proteins hBfl-1, hMcl-1, hBcl-xL, and hBcl-2 by compounds 130E7, 130E8 (hBIM), and ABT-199. The arrows emphasize differences in affinities against each of the tested proteins between 130E7, ABT-199, and 130E8. The covalent agent 130E7 showed an increase in affinity only against Bfl-1, owed to the covalent interaction with Cys 55, while reduced affinities are observed between this agent and other Bcl-2 proteins lacking such residues in the BH3 binding groove. Panel D: SDS-PAGE gel electrophoresis followed by Coomassie staining of the hBfl-1 protein (10 μM) in absence and presence of equimolar concentrations of 130E7 at different time points (15 min, 30 min, 1 h, 2 h). Panel E: MALDI-TOF MS spectra of hBfl1 collected in the absence (blue) and presence (green) of 130E7 after 2 h incubation at RT and at a protein–ligand ratio of 1:2.

