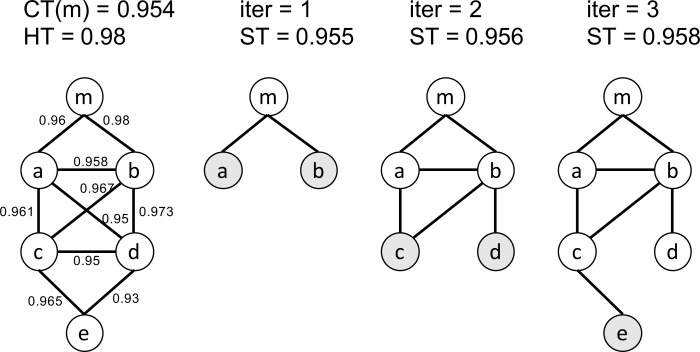
Fig. (3).
An example of the soft thresholding algorithm. Nodes in dark color represent the boundary gene set in each iteration. The leftmost network represents the adjacency matrix Madj after applying the user-given lower bound threshold. The numbers on the edges indicate the weights of the edges (PCC values).

