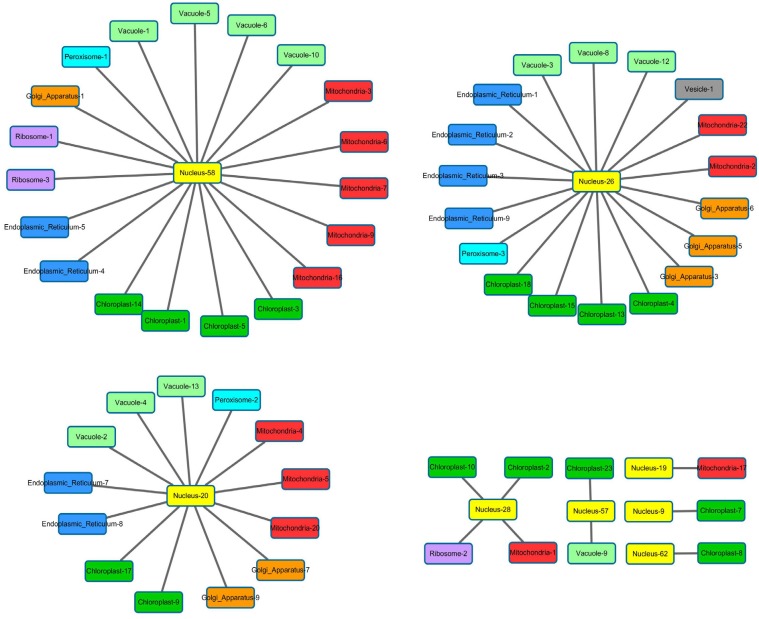
Fig. (8).
The network of functional modules under osmotic stress consists of three major star graphs. Color represents different type of organelles. Each star graph has multiple types of organelles, suggesting organelles need to interact with each other to deliver complex functions, and according to Gene Ontology the three star graphs have distinct functions.

