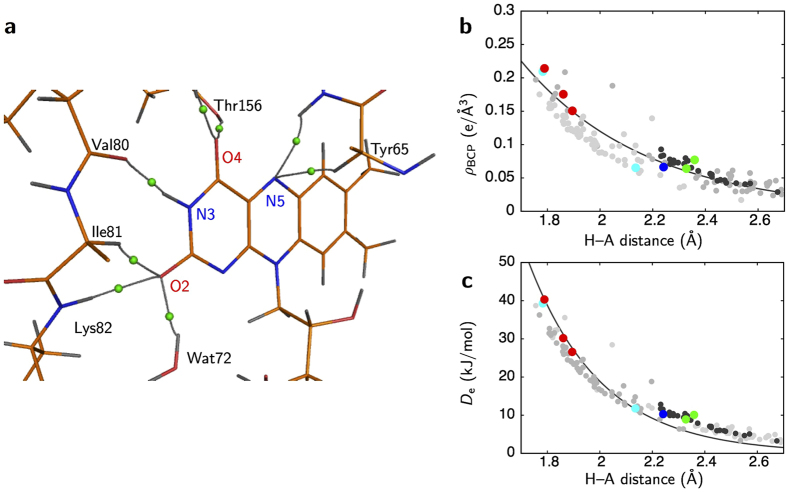
Figure 4. Interactions between FAD and the protein environment.
(a) The bond paths of hydrogen bonding around the isoalloxazine ring. BCPs of the hydrogen bonding are represented as green spheres. (b) Dependence between  distance and ρBCP for hydrogen bonding. Filled circles in cyan, blue, red and green are for NH
 O, NH
O, NH N, OH
N, OH O and CH
 N/O bonds, respectively. A relationship derived from small molecules29 is overlaid as a solid curve in gray. Small gray circles represent the NH
 O, NH
O, NH N and OH···O bonds in the main chain. Dark-gray circles also represent the CαH
 N/O bonds. (c) Dependence between the
  distance and dissociation energy De.

