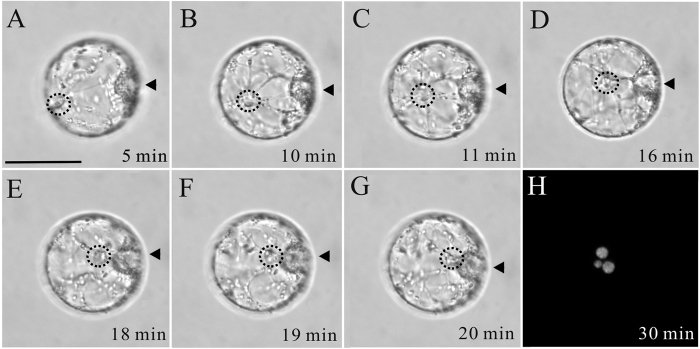
Figure 3. Time-lapse images of the sperm nuclear migration process after in vitro fusion of the tobacco sperm cell and central cell induced in PEG medium.
(A–G) Images were taken at varying time intervals over a period of 30 min, as indicated in the bottom right corner of each image. Dotted circles indicate sperm nuclear location and arrowheads indicate polar nuclei of the central cell in (A–G). Cytoplasmic strands around sperm nucleus were also present (A–G). (H) The fertilized central cell shows three nuclei stained by DAPI 30 min after membrane fusion. The smallest nucleus is from the sperm, the other two larger nuclei are the polar nuclei of the central cell. Scale bar = 50 μm.

