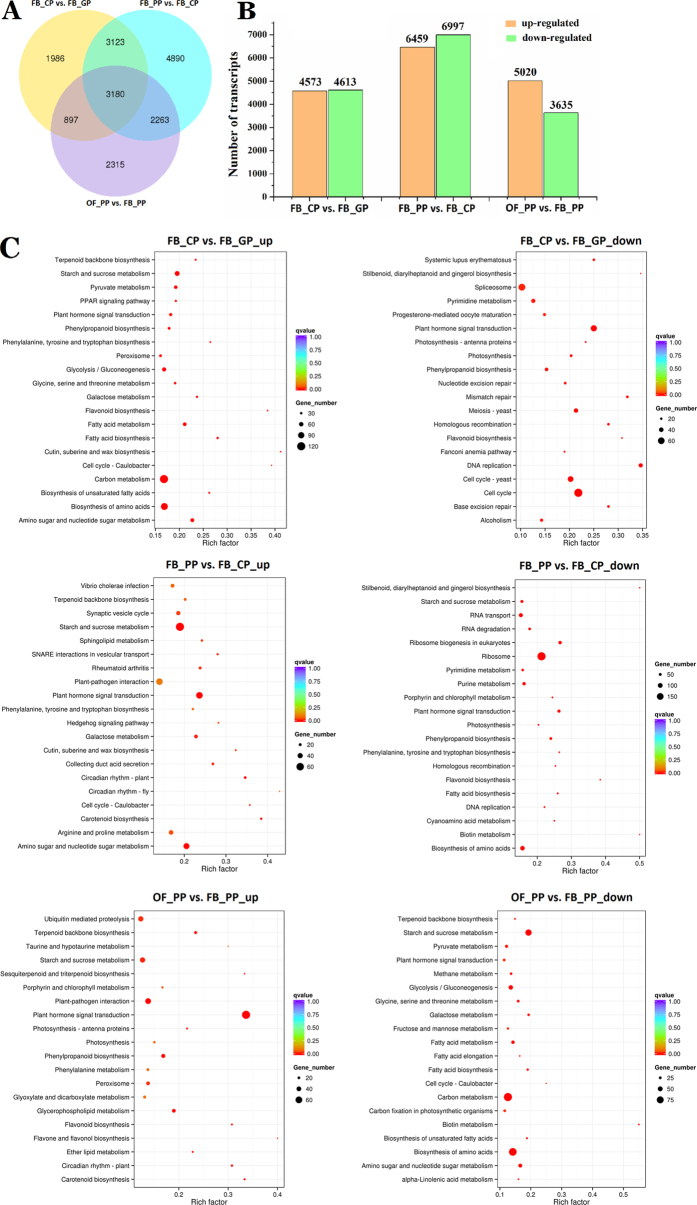
Figure 3. Comparative analysis of differentially expressed genes (DEGs) between the four stages of petal development.
(A) Venn diagram of the number of DEGs (Padj < 0.05) between the stage comparisons: FB_CP vs. FB_GP, FB_PP vs. FB_CP, and OF_PP vs. FB_PP. (B) The number of up-regulated and down-regulated DEGs between the three comparisons (FB_CP vs. FB_GP, FB_PP vs. FB_CP, OF_PP vs. FB_PP). (C) KO category enrichment of up-regulated and down-regulated DEGs. The number of genes in each category is equal to the dot size. The dot colour represents the q-value.

