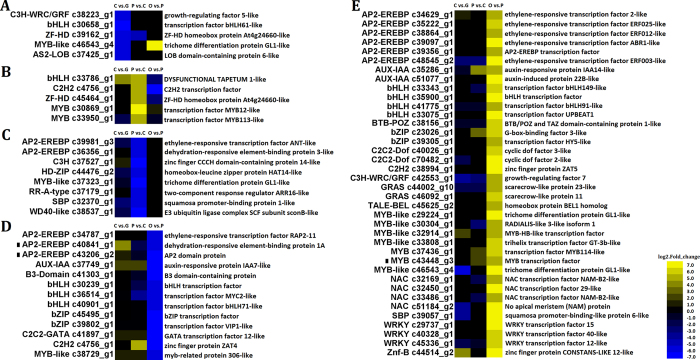
Figure 7. Heat maps of transcription factors (TFs) with significant expression changes during Rosa chinensis petal development.
“C vs. G” represents FB_CP vs. FB_GP, “P vs. C” represents FB_PP vs. FB_CP, and “O vs. P” represents OF_PP vs. FB_PP. Yellow and blue indicate up- and down-regulated transcripts, respectively, from the three comparisons (log2-fold change), while a black dot indicates a transcript for which the putative homolog gene has been previously registered in the NCBI database. Each gene prediction has been marked on the right. All genes are listed in detail in Supplementary Table S13. (A) TFs with ≥ five-fold down-regulated expression in FB_CP vs. FB_GP. (B) TFs with ≥ five-fold up-regulated expression in FB_PP vs. FB_CP. (C) TFs with ≥ five-fold down-regulated expression in FB_PP vs. FB_CP. (D) TFs with ≥ five-fold down-regulated expression in OF_PP vs. FB_PP. (E) TFs with ≥ five-fold up-regulated expression in OF_PP vs. FB_PP.

