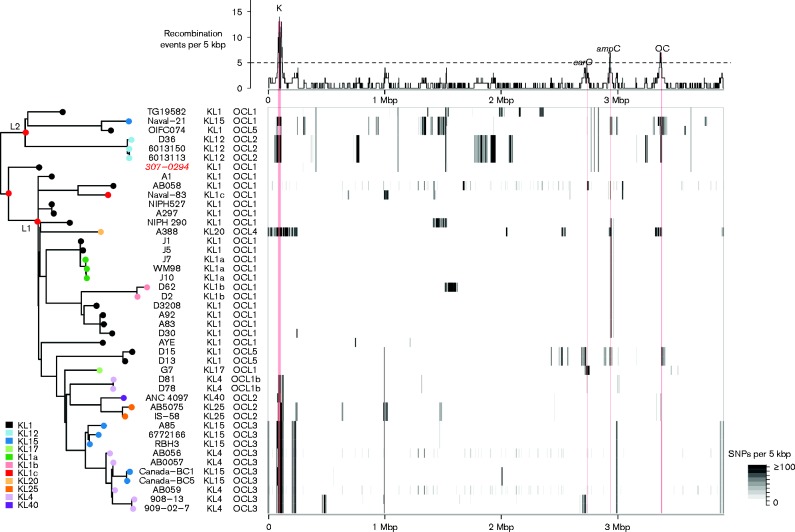
Fig. 1.
Summary of genome variation in A. baumannii GC1. Heatmap (centre): density of SNPs identified in each genome compared with the A1 reference. Plot (top): density of recombination events detected within the GC1 genomes, across the A1 reference genome, inferred from the SNP data using Gubbins. Tree (left): ML phylogeny of genome-wide SNPS, excluding those attributed to recombination events in the Gubbins analysis. L1 and L2, lineages 1 and 2; red nodes have 100 % bootstrap support. Note the isolate highlighted in red has low confidence SNP calls and its position in the tree is uncertain.

