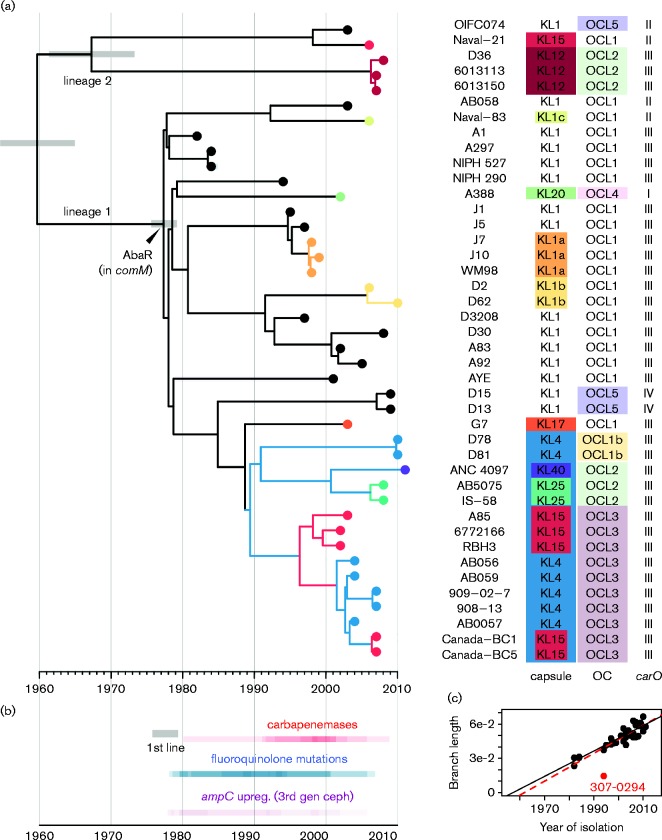
Fig. 2.
Temporal and phylogenetic analysis of 43 A. baumannii GC1. (a) Dated whole-genome phylogeny constructed using beast. x-axis, calendar years; grey bars, 95 % highest posterior density for divergence dates of selected nodes; tip colours, KL types; branch colours, clades sharing a recombination event resulting an exchange of the KL. Tips are labelled with isolate names and the KL and OC types, coloured to highlight those that differ from the inferred ancestral types KL1 and OCL1. (b) Heated timeline indicating time intervals in which antimicrobial resistance-associated mutations arose, inferred from the tree by overlaying x (time) coordinates of branches on which the mutational events occurred. Upreg. (3rd gen ceph), upregulation of ampC gene expression resulting in resistance to third-generation cephalosporins. (c) Scatter plot showing linear relationship between year of isolation and ML branch lengths (tree shown in Fig. 1). Red point, isolate for which genome data may be unreliable (excluded from beast analysis); black line, regression line excluding this isolate; red line, regression line including all isolates.

