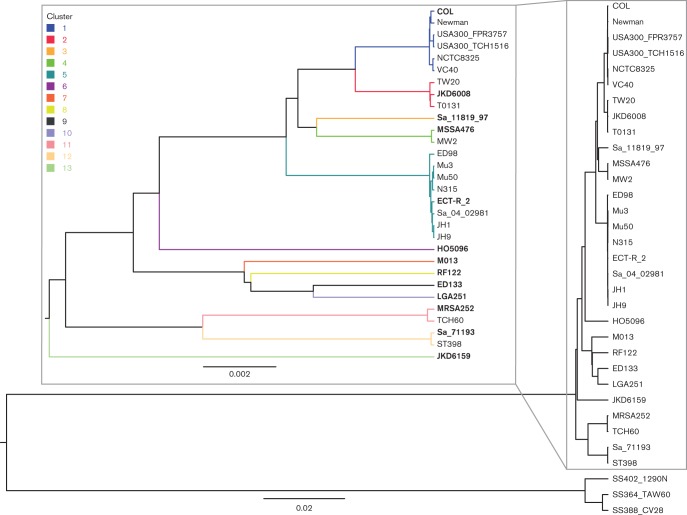
Fig. 1.
Phylogenetic tree of the investigated Staphylococcus strains. Inset: Enlarged view of the S. aureus branch illustrating the clustering of the strains within clonal complexes. The scale measures base-level sequence dissimilarity, showing that the S. aureus clusters differ by approximately two to ten substitutions every 1 kb while strains within each cluster differ by less than one substitution every 5 kb.

