Figure 3.

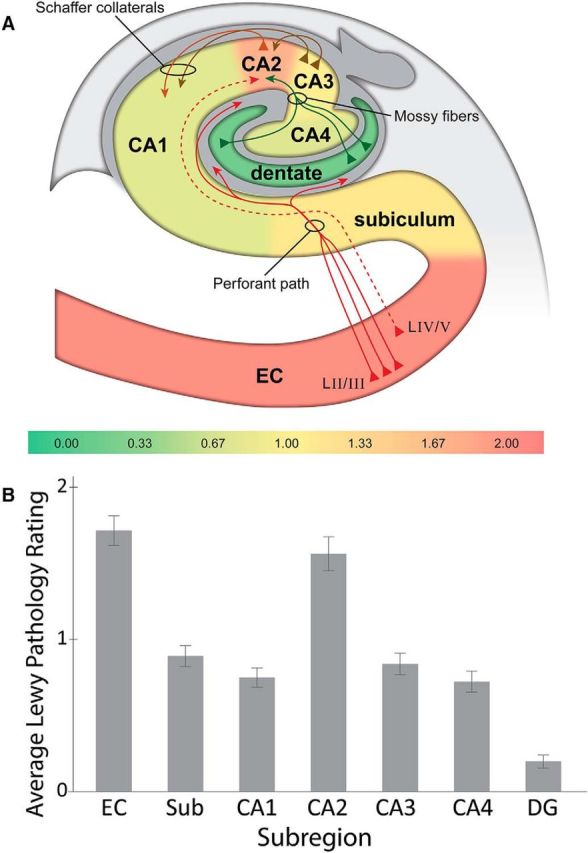
Distribution and severity of Lewy pathology show differential regional involvement. A, Heat map of Lewy pathology in hippocampal subfields from DLB cases (n = 95) shows increased burden in area CA2 and entorhinal cortex. The DG is relatively free of pathology by comparison. The color-coded scale is based on average pathology rating per subregion. Major known hippocampal projections are displayed as solid lines, whereas the suspected EC–CA2 circuit is shown as a dashed line (hippocampal diagram adapted with permission from Yang et al., 2008). B, Graphical representation of heat map data. Sub, Subiculum. Error bars indicate ± SE.
