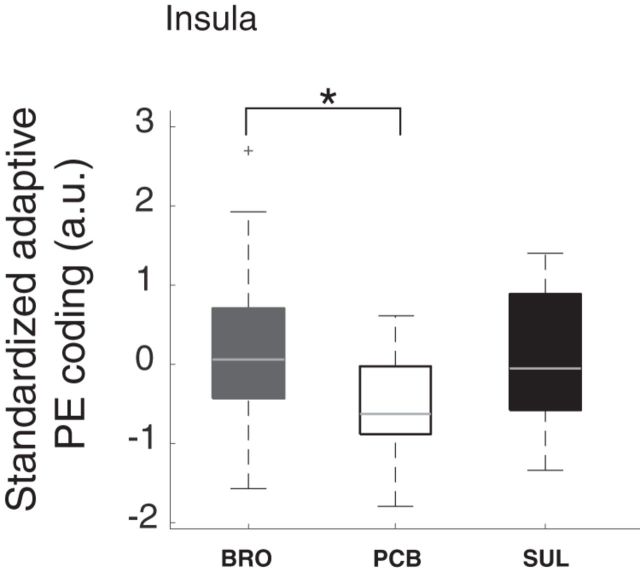
Figure 6.
Median and range of average BOLD responses to the cues predicting reward variability. The dopaminergic modulation perturbed responses to the reward variability predicting cues on trend level. This effect was driven by a difference between the bromocriptine and the placebo group. Boxplot represents standardized (i.e., z-scored) residual adaptive coding values after correction for the time between dosing and the start of the fMRI scan as this time differed between the treatment groups (for details, see Results). Thus, higher values on the y-axis indicate an increase in BOLD responses to the reward predicting cues after adjusting the data for the effect of the time between dosing and the start of the fMRI scan. * indicates significance. a.u., arbitrary units; BRO, bromocriptine; PCB, placebo; PE, prediction error; SUL, sulpiride.

