Figure 3.
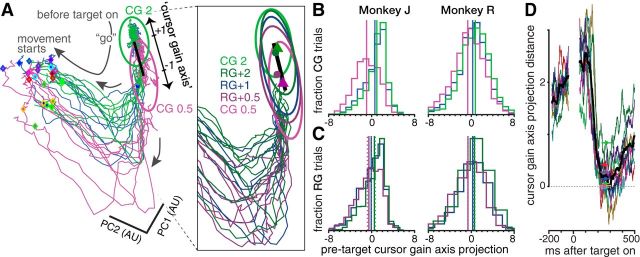
Pretarget neural population state reflects recent visuomotor gain experience. A, Visualization of neural activity just before and at the start of reaches. The main panel shows 24 trial-averaged neural trajectories for the CG conditions, broken out by reach target (3 gains × 8 targets). Condition-averaged firing rates are projected onto the data's first two principal components (which capture 65% of the variance). Trajectories consist of one segment spanning 300–40 ms before target on (confined to the upper-right corner) and another segment 25–285 ms after target on (clockwise rotation). Mean reaction times for each condition are shown with diamonds with a unique border color for each of the eight targets. The bright violet and green ellipses show one SD of single-trial variance of the pretarget CG 0.5 and CG 2 neural state (combining across targets), respectively. We define a cursor gain axis (thick black line) connecting the centroids of these pretarget states. The inset shows an enlarged view of the neural state space close to the gain axis, now showing neural trajectories for RG conditions grouped by the previous trial's gain, denoted by a darker hue of the corresponding gain's color. The CG 0.5 and CG 2 variance ellipses and gain axis are replicated in the inset, along with 1 SD ellipses of RG conditions' pretarget state. Also shown are the RG+0.5 and RG+2 pretarget state centroids (violet and green circles), along with the centroids for trials preceded by two RG 0.5 trials in a row (violet triangle) and trials preceded by two RG 2 trials in a row (green triangle). Dataset was J.2014.09.12. The same color scheme is used to denote different gain conditions throughout A–C. B, Histograms of CG trials' pretarget neural states projected onto the gain axis. Each trial's projection were calculated based on within-dataset CG 0.5 and CG 2 centroids and then aggregated over all five of each monkey's datasets. Vertical lines show the corresponding distribution's mean. C, Similar to B, but now showing the distribution of RG trials' gain axis projections. Trials are grouped based on the visuomotor gain applied on the previous trial to determine whether experiencing a particular gain changes the subsequent center hold period's pretarget neural state. Solid vertical lines show the corresponding distribution means. Dashed vertical lines show the distribution means after two consecutive trials of the same gain (histograms for these distributions are not shown). D, Contrary to the impression given by the low-dimensional view in A, the separation between CG 0.5 and CG 2 neural trajectories along the gain axis did not persist as the reach progressed. Each colored trace corresponds to the difference between CG 0.5 and CG 2 trials' full-dimensional neural data projected onto the gain axis (data were averaged across trials to one of the eight targets). The black trace corresponds to the mean of these individual target traces. Mean ±1 SD of reaction times for each target are shown with colored horizontal bars. The pretarget gain axis separation of ∼2 is reduced to nearly 0 by the time movement starts. Dataset was J.2014.09.12.

