Figure 4.
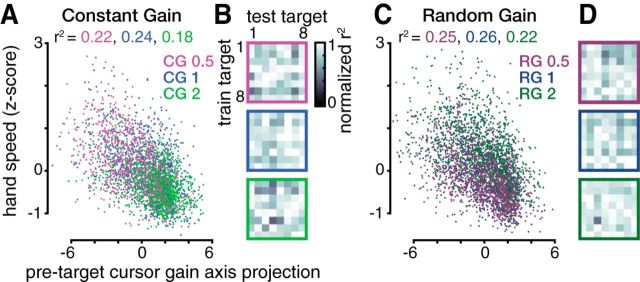
Pretarget neural state predicts upcoming reach speed. A, Pretarget firing rates' projection onto the gain axis explains a significant fraction of the variance in subsequent hand reach speed (linear regression). Each point corresponds to one CG trial, with colors denoting visuomotor gain. The fraction of speed variance explained by the gain axis projection for each condition is written above in the corresponding color. More positive gain axis projections (putatively signaling that the animal is expecting a higher gain) correlate with slower upcoming reaches and vice versa for more negative projections. Data are aggregated across all five monkey J datasets. Three data points are cut off on the left. B, To assess whether the gain axis generalizes across reach directions, we predicted hand speeds separately for CG reaches to each of the eight targets using a target-specific gain axis determined using reaches to a single (potentially different) target. Each element within the 8 × 8 data matrices shows how much of the variance in reach speeds to the target corresponding to the column number (test target) was explained by projecting that trial's pretarget firing rates onto a target-specific gain axis calculated using only trials immediately after reaches to the target corresponding to the row number (train target). Variance explained (r2) values within each column (i.e., when predicting hand speed for the same trials, using different train target-specific gain axes) were normalized to the maximum value within this test target. Each 8 × 8 matrix shows results for one gain condition, denoted by the border color. The best regression performances did not cluster along the (train target) = (test target) diagonal and a significant fraction of CG hand speed variance was explained by pretarget neural state for all 8 × 8 × 3 train–test pairs (p < 0.05). This indicates that the behavioral relevance of the gain axis generalizes across reach targets. C, Same as A, but for RG trials grouped by the upcoming trial's gain. Two and three data points are cut off from the top and left, respectively. D, Same as B, but for RG trials grouped by the upcoming trial's gain. A significant fraction of RG hand speed variance was explained by pretarget neural state for all 8 × 8 × 3 train–test pairs (p < 0.01).

