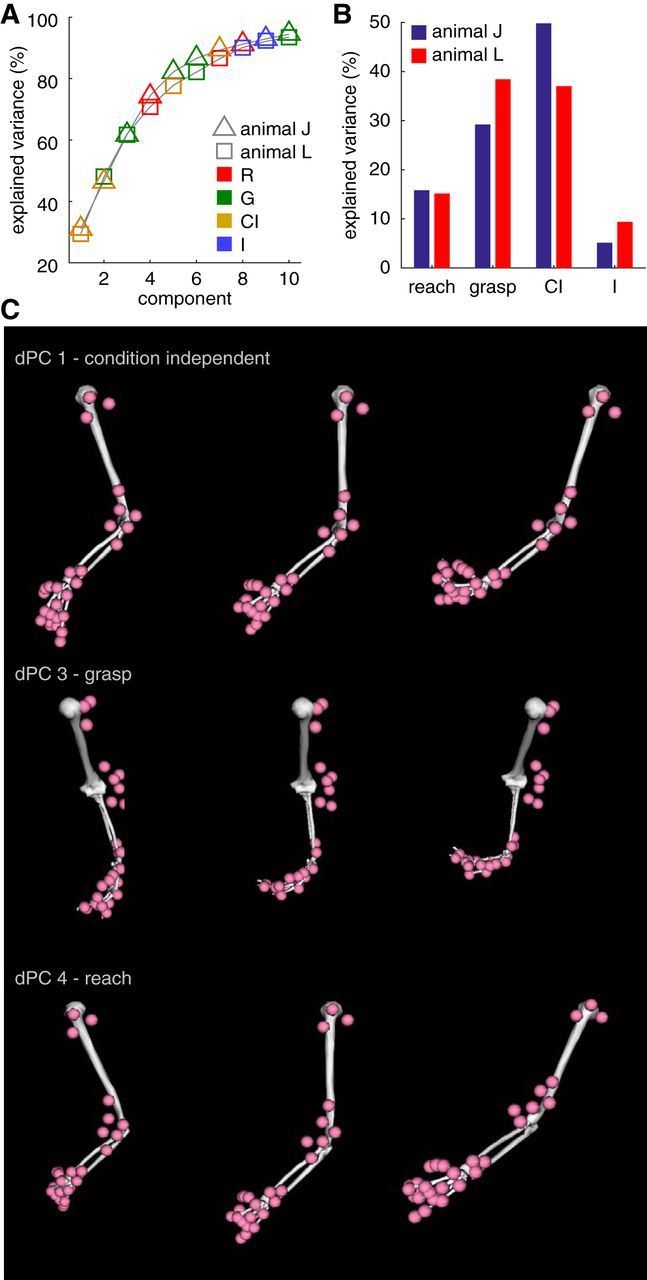
Figure 3.

dPCA. A, Scree plot of dPCA. The cumulative percentage of explained variance for a given number of dPCs is shown for joint angles. Each individual component varies only along one task parameter. It can be reach related (R, red points), grasp related (G, green points), condition independent (CI, gold points), or an interaction between reach and grasp condition (I, blue points). Marker shape (either square or triangle) indicates animal. Note that the scree plots are highly similar across animals. B, Percentage of variance explained by the different task conditions in joint angle data. C, Visualization of kinematic synergies revealed by the dPCA. The posture of the upper limb is shown at various projections along the largest condition independent synergy (top row), the largest grasp synergy (middle row), and the largest reach synergy (bottom row). Data are from animal J.
