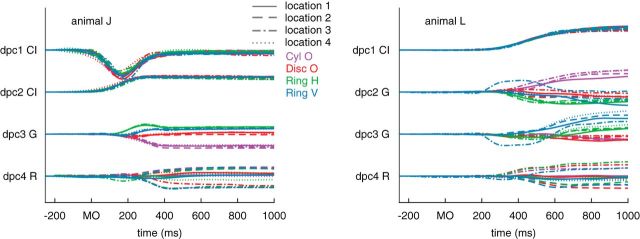
Figure 4.
Trial-averaged dPCA trajectories relative to movement onset. The temporal profile of the first four dPCs is shown for the various object locations and grips. Conventions are the same as Figure 2. To the left of each dPC is an indication of whether it is a CI, grasp (G), or reach (R). The components are ordered from top to bottom in terms of variance explained; that is, dPC1 explained more variance than all others.

