Figure 12.
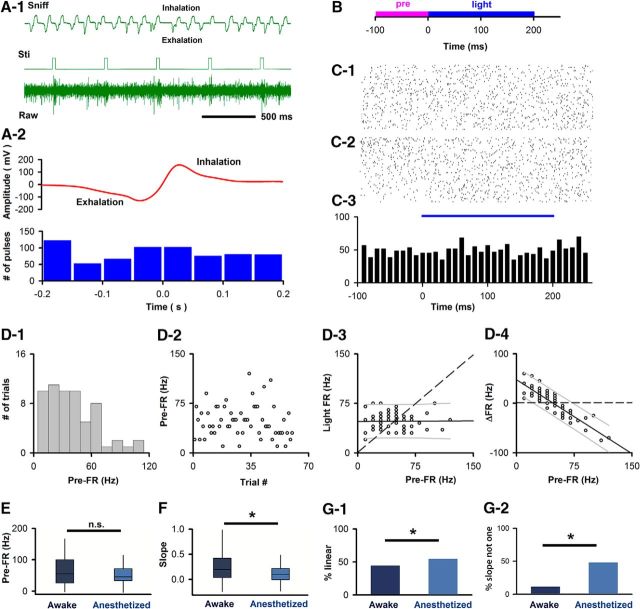
M/T cell responses to optogenetic activation of olfactory neuron axons, applied at random times, depend on pre-FR. A, Optogenetic activation performed at random times within the sniff cycle. A1, Example of extracellular potential (Raw) and voltage recorded by the nose pressure sensor (Sniff). Light pulses (Sti). A2, Light pulses are not synchronized with sniff. Top, Average pressure voltage (681 sniffs). Bottom, Light activation. A Rayleigh test indicated that there was no specific distribution (p < 0.05) (reproduced from Li et al., 2014). B, Time course per trial. C, D, Example SU from awake mouse. C1, C2, Raster plots. C1, Unsorted. Bottom-top, First-last. C2, Sorted. Bottom-top, Lowest-highest pre-FR. C3, PSTH. D, Dependence of Light FR on pre-FR in an example SU (same SU as C). D1, Histogram of the per-trial pre-FRs. D2, Trial-to-trial variability in pre-FR. D3, Dependence of light FR on pre-FR. Dashed line indicates light FR = pre-FR unity line. The slope of the best-fit line was linear and different from 1 (plinear ≤ pFDR, pFDR0 degrees = 0.0179, pFDR−45 degrees = 0.0057, n = 70 SU-light pairs; pdifferent from 1 ≤ pFDR = 0.0057, n = 70 SU-light pairs). Best-fit slope 0, intercept 47.6 Hz. D4, Dependence of ΔFR on pre-FR. Solid line indicates a best fit of the data. Dashed line indicates ΔFR = 0. Thin lines above and below the solid line indicate 5th and 95th percentile estimates. Best-fit slope and intercept (Hz): −0.99, 47.6. E, Box-and-whiskers plot showing that mean pre-FR for SU-light pairs does not differ between awake (n = 70) and anesthetized (n = 79) mice (MWT, p = 0.2869). Conventions for the box-and-whisker plot: box represents the interquartile range (first to third quartile) and the median value (line), and whiskers extend to the most extreme data point within 1.5 times the interquartile range. F, Box-and-whiskers plot for slopes of best fit light FR versus pre-FR line for SU-light pairs differ between awake (n = 70) and anesthetized (n = 79) mice (MWT, p < 0.01). G1, Percent of SU-light pairs with a linear dependence of light FR on pre-FR differs between awake and anesthetized mice (χ2, p < 0.05). G2, Percent of SU-light pairs with a linear dependence with a slope distinct from 1 differs between awake and anesthetized mice (χ2, p < 0.0001). *Statistically significant.

