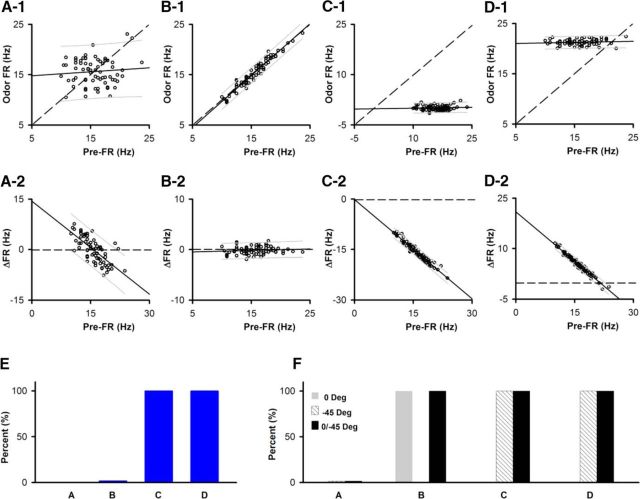
Figure 3.
Statistical test of linearity and difference in the slope from 1 for simulation of different dependences of odor FR on pre-FR. The pre-FR dependence for 1451 SU-odor pairs recorded from in the go-no go task (examples shown in Fig. 4D1–F1) were resampled to yield different odor FR versus pre-FR dependences. A–D, Examples of odor FR versus pre-FR (A1,B1,C1,D1) or ΔFR versus pre-FR (A2,B2,C2,D2) for the different dependences generated by resampling the pre-FR for the SU shown in Figure 4F1. Solid line indicates a best fit of the data. Dashed line indicates odor FR = pre-FR or ΔFR = 0. Thin lines above and below the solid line indicate 5th and 95th percentile estimates. A, Odor FR and pre-FR are independently resampled from the pre-FR distribution. B, Odor FR = pre-FR + random normal noise with an SD equal to one-fourth of the SD of the pre-FR distribution. C, Odor FR = 0 + random normal noise with a SD equal to one-fourth of the SD of the pre-FR distribution. D, Odor FR = 95 percentile pre-FR + random normal noise with a SD equal to one-fourth of the SD of the pre-FR distribution. Best-fit slope and intercept (Hz): A1, 0.08, 14.4; A2, −0.92, 14.3; B1, 1.03, −0.62; B2, 0.03, −0.62; C1, 0.018, −0.17; C2, −0.98, −0.17; D1, 0.02, 20.9; D2, −0.98, 20.9. E, F, The dependences shown in A–E were simulated for the 1451 SU-odorant pairs recorded in the go-no go experiments (Fig. 4) and were then tested for difference of the slope from 1 (E) or linearity (F) for odor FR versus pre-FR with correction for multiple comparisons as explained in Materials and Methods. E, Percent of slopes different from 1. F, Percent linear. Gray represents percent significant for an F test for linear best fit of odor FR versus pre-FR (0 degrees). Dashed lines indicate F test for linear best fit of odor FR versus pre-FR performed after the axes were rotated by −45 degrees. Black represents percent significant in either the 0 or −45 degrees tests.

