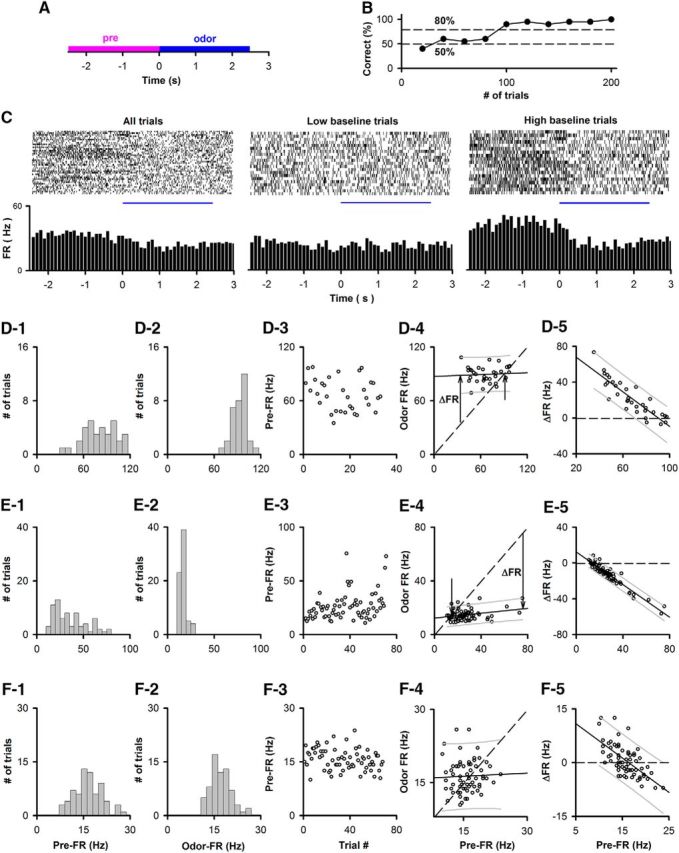
Figure 4.

Examples in the go-no go task of the linear dependence of the trial-to-trial variability of the odorant-induced change in FR on the pre-FR in a subset of M/T cells. A, Time course for each trial. Pre-FR is defined as the FR for 2.5 s before addition of the odorant (pre), and odor-FR is the FR for 2.5 s during exposure to the odorant (odor). B, Example of behavioral performance during a session of 200 trials in the go-no go task. Percent correct: percent of trials when the animal responded correctly in blocks of 10 rewarded/10 unrewarded odorant trials. C, Example of odorant responses for a SU. Top, Raster plots (bottom to top: first to last trial). Bottom, PSTH. Left to right, All, low and high pre-FR trials (high pre-FR ≥ mean pre-FR). D–F, Examples of the dependence of odor FR on pre-FR. D1–F1, Histogram of mean per-trial pre-FRs for the entire go-no go session. D2–F2, Histogram of mean per-trial odor-FRs for the entire go-no go session. D3–F3, Trial-per-trial variability for pre-FR through the session. D4–F4, Dependence of odor FR on pre-FR. Dashed line indicates odor FR = pre-FR. The slope of the best-fit line was statistically different from 1 for D4 and E4, but not for F4. The difference of the slope from 1 was tested using significance for best linear fit corrected for multiple comparisons by calculating the critical significance level of the false discovery rate (pFDR) (Curran-Everett, 2000) as explained in Materials and Methods (D3,E3: p ≤ pFDR = 0.0055, n = 1451 SU-odor pairs). A statistical test of linearity corrected for multiple comparisons indicated that D4 and E4, but not F4, were linear (significant p values < pFDR, pFDR0 degrees = 0.028, pFDR−45 degrees = 0.055, n = 1451 SU-odor pairs; for details on statistical test for linear dependence, see Materials and Methods and Fig. 3). D4, E4, Unlabeled arrow indicates the point where the best-fit line and odor FR = pre-FR cross. ΔFR is the odor-induced change in FR, which is shown at a specific pre-FR in D4 and E4. Best-fit slope and intercept (Hz): D4, 0.034, 87.1; E4, 0.09, 12.3; F4, 0.043, 15.6. D5–F5, Dependence of ΔFR on pre-FR. Solid line indicates a best fit of the data. Dashed line indicates ΔFR = 0. Thin lines above and below the solid line are 5th and 95th percentile estimates. Best-fit slope and intercept (Hz): D5, −0.97, 87.1; E5, −0.91, 12.3; F5, −0.96, 15.6.
