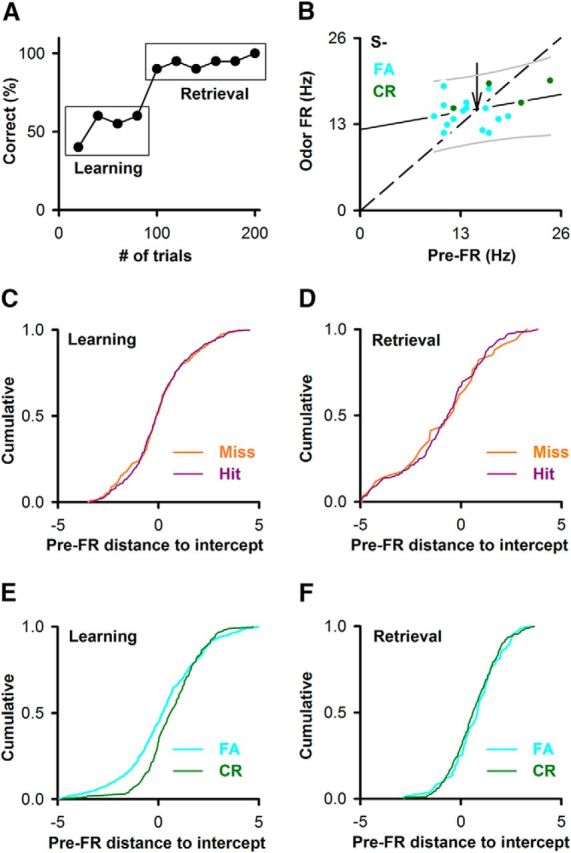
Figure 6.

The pre-FR differs between correct rejections and FAs when the animal is learning to differentiate between the two odorants. A, Example of behavioral performance during a session of 200 trials in the go-no go task. Percent correct: percent of trials when the animal responded correctly in blocks of 10 rewarded/10 unrewarded odorant trials. Learning is the segment for percent correct ≥45% and ≤65%. Retrieval is the segment for percent correct ≥80%. B, Example for an SU-odor pair of the dependence of odor FR on pre-FR for the unrewarded odorant during the learning segment. Green represents CR. Light blue represents FA. This dependence tested significant for linearity and with a slope different from 1. Solid line indicates the best fit. Dashed line indicates odor FR = pre-FR. Thin solid lines above and below the best-fit line are 5th and 95th percentiles. Unlabeled arrow indicates the point where the best-fit line and odor FR = pre-FR cross. Best-fit line slope and intercept: 0.2, 12.3 Hz. C–F, Cumulative probability for the distance along the pre-FR axis between a point and the intercept between the best-fit line and odor FR = pre-FR. Dividing by the SD of pre-FR normalized this distance. C, Hits versus Miss for the learning segment (Kolmogorov–Smirnov, p = 0.82, number of trials: 577 hits, 186 misses, pFDR = 0.04, 28 pairwise comparisons). D, Hits versus Miss for the retrieval segment (Kolmogorov–Smirnov, p = 0.99, number of trials: 190 hits, 34 misses, pFDR = 0.04). E, CR versus FA for the learning segment (Kolmogorov–Smirnov, p < 0.0001, number of trials: 233 CRs, 667 FAs, pFDR = 0.04). F, CR versus FA for the retrieval segment (Kolmogorov–Smirnov, p = 0.63, number of trials: 398 CRs, 86 FAs, pFDR = 0.04).
