Figure 8.
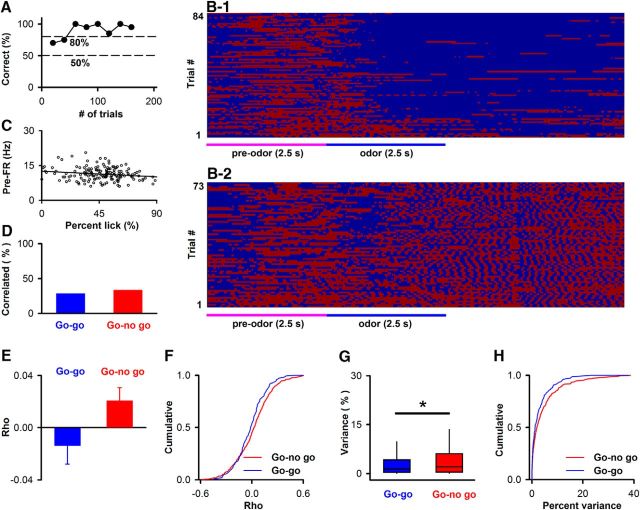
Dependence of prestimulus FR on licking. A, Performance of a mouse in a go-no go experiment. B, Trial per trial time course for licks for the experiment whose behavioral performance is shown in A. Red represents tongue touches the lick tube. C, Example of the relationship between pre-FR and the percent of the time that the mouse licks in the preodor period (percent lick) for an SU recorded from in this session. Line indicates the best fit (slope = −0.027, intercept = 12.6). The correlation coefficient (−0.18) was not significant (p = 0.024 > pFDR = 0.017, n = 383 SUs for go-no go). Best-fit slope −0.02 Hz/%, intercept 12.7 Hz. D, Percent of SUs that display a statistically significant correlation between pre-FR and percent lick (pFDR is 0.014 for 150 SUs in the go-go sessions, χ2, p value for difference in percent correlation > 0.05). E, Mean and SEM for the correlation coefficients for all SUs recorded from in the go-go and go-no go sessions (unpaired t test, p = 0.08). F, Cumulative distribution of correlation coefficients (Kolmogorov–Smirnov, p = 0.04). G, H, Percent of the variance of pre-FR that is accounted for by the dependence between pre-FR and percent lick (percent variance) determined for SUs that displayed significant correlation (129 SUs for go-no go and 43 SUs for go-go). G, Boxplot for percent variance (MWT, p = 0.04). H, Cumulative distributions for the percent variance (Kolmogorov–Smirnov, p = 0.15). *Statistically significant.

