Figure 1.
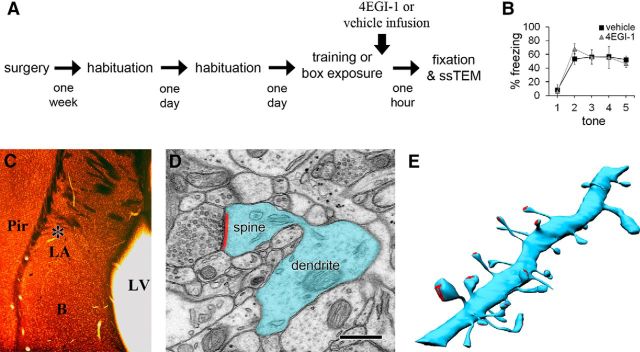
Experimental procedures. A, Time line of behavioral training, drug infusion, and tissue collection. B, Graph of the percentage of time animals spent freezing during each of the five tones presented during training, showing equivalent acquisition between the vehicle and drug groups. Error bars indicate SEM. C, Tissue embedded for electron microscopy showing sampling location (asterisk) for serial sections. B, Basal amygdala; LV, lateral ventricle; Pir, piriform cortex. D, Electron micrograph (EM) of a dendrite (blue) with a spine forming a synapse (red). Scale bar, 500 nm. E, Three-dimensional rendering of a 10 μm segment of dendrite (blue) and its synapses (red) reconstructed through serial EM sections.

