Figure 3.
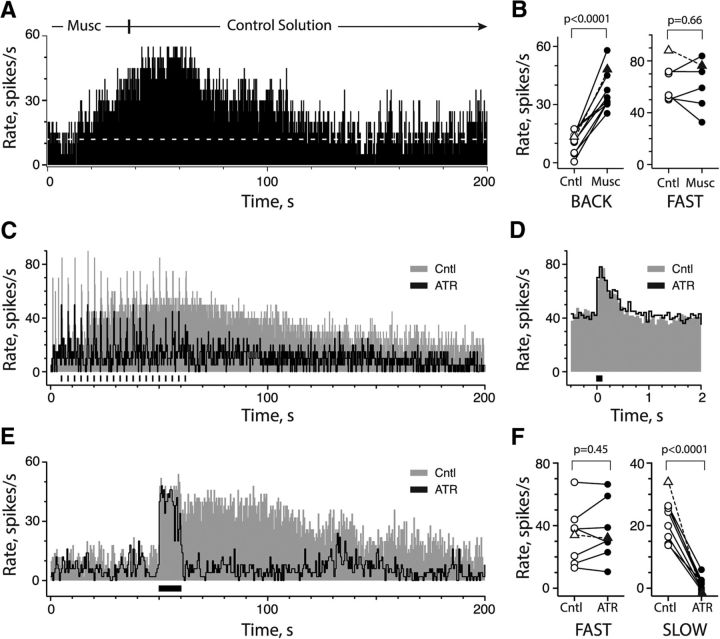
Activation of mAChRs underlies slow excitation in CD afferents. A, Continuous rate histogram was acquired during the application of 50 μm muscarine. Dashed white line, Prestimulus discharge rate. B, Afferent background rates for nine CD afferents (left, BACK) and peak efferent-mediated fast excitation in six CD afferents (right, FAST) are plotted before (Cntl; open symbols) and after muscarine (Musc; filled symbols) administration. C, Continuous rate histogram from CD afferent to 20 presentations of short efferent shock train (20 shocks at 200/s; black bars) before and after administration of 1 μm atropine. Excitatory bursts in α period (t = 0–5 s) were unrelated to efferent stimulus, did not persist beyond the α period, and were absent from subsequent recordings in this unit. D, Corresponding average response histograms for efferent-mediated fast excitation during control conditions and atropine application were constructed from data in C. Histograms were aligned by shifting the atropine trace to match the mean prestimulus rate of the control (14.1 vs 46.1 spikes/s). E, Continuous rate histogram from same CD afferent during a 10 s efferent shock train (1000 shocks at 100/s) before and after administration of 1 μm atropine. F, Peak efferent-mediated fast excitation (left) for eight CD afferents and peak slow excitation (right) for nine CD afferents are plotted before (Cntl; open symbols) and after application of atropine (ATR; filled symbols). Triangles with dashed lines in B and F represent units shown in A and C, respectively.

