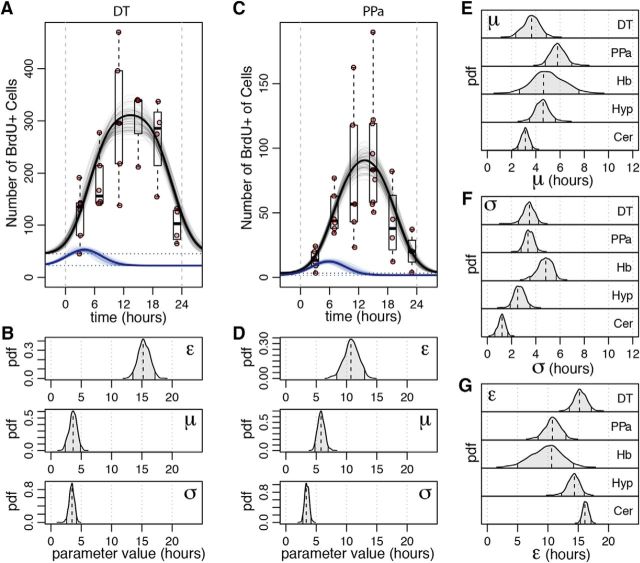
Figure 2.
Statistical modeling of circadian kinetics of S-phase progression in diverse neurogenic niches of adult zebrafish brain. A, Boxplots show the number of BrdU+ cells in DT niche, observed at different time points throughout the day. The values for each individual fish are shown as red dots. The black curves show the overall fit of the statistical model (see Materials and Methods) for the observed number of BrdU+ cells. The rate of S-phase entry predicted by the model is shown by blue curves. For both curves, the line shows the maximum likelihood model predictions, and thin lines around it show predictions sampled from the posterior ensemble of the likely model parameter estimates. B, Marginal posterior distributions of the individual model parameters for the DT niche, including mean (μ) and dispersion (σ) of the S-phase entry rate function G(t) and the length of the S-phase (ε). The shaded region under the curve marks the 95% credible interval. C, D, Fit illustration and posterior distributions for the PPa niche. E–G, Marginal posterior distributions of the μ, σ, and ε parameters for all of the examined neurogenic niches.

