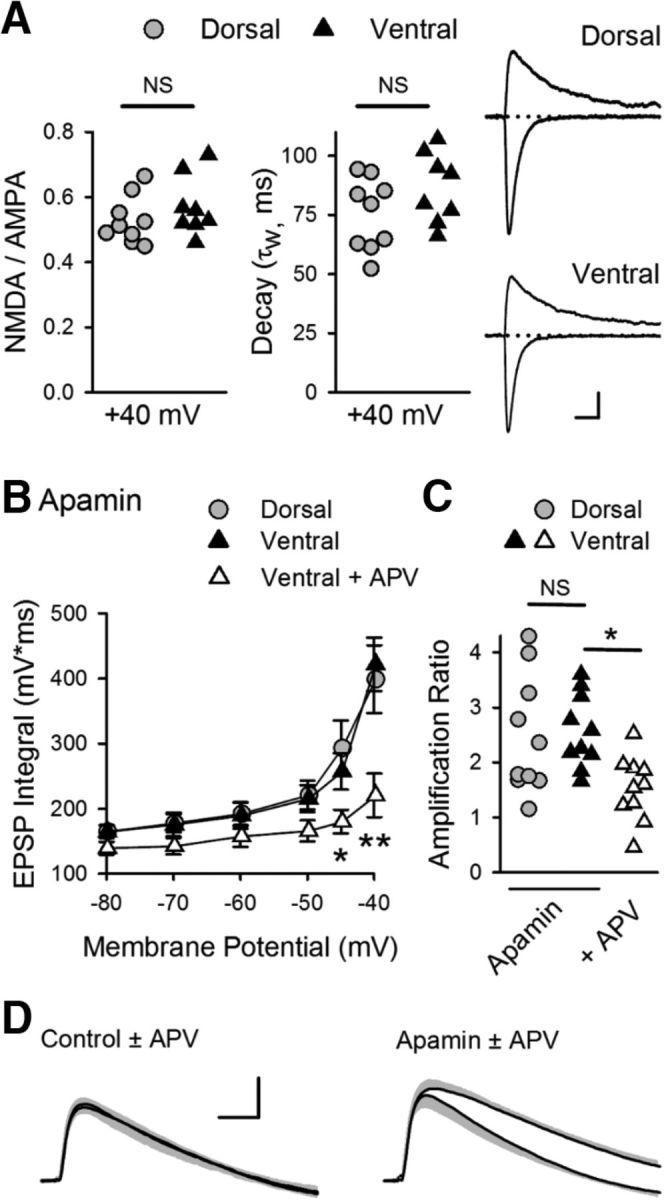
Figure 8.

SK channel suppression of NMDAR activation and EPSP amplification at SC synapses in ventral hippocampus. A, Ratio of NMDAR- and AMPAR-mediated components (left) and decay time constants (middle) for EPSCs recorded at Vm = 40 mV in dorsal and ventral pyramidal cells (n = 9 dorsal and n = 8 ventral cells). Ratios were 0.52 ± 0.02 and 0.57 ± 0.03 in dorsal and ventral cells, respectively (p = 0.312, Student's t test: t(15) = 1.046). Decay time constants were 75 ± 5.1 ms in dorsal cells and 86 ± 5.2 ms in ventral cells (p = 0.15, Student's t test: t(15) = 1.517). Right, Traces represent example EPSCs recorded at −80 and 40 mV. Calibration: 75 pA, 20 ms. B, Blocking SK channels with 100 nm apamin enables NMDAR-mediated EPSP amplification in ventral pryamidal cells. *p < 0.05 (two-way ANOVA with Student-Newman-Keuls post hoc multiple-comparisons test). **p < 0.001 (two-way ANOVA with Student-Newman-Keuls post hoc multiple-comparisons test). p = 4.1 × 10⁻⁷, F(2,162) = 16.12 (n = 10 dorsal and n = 10 ventral cells in apamin, n = 10 ventral cells in apamin plus d-APV). C, Amplification for all cells in the presence of apamin or apamin plus d-APV. Amplification in the presence of apamin was 2.5 ± 0.34 and 2.6 ± 0.21 for dorsal and ventral pyramidal cells, respectively, and 1.7 ± 0.17 for ventral cells in the presence of apamin + d-APV. *p < 0.05 (one-way ANOVA with Student-Newman-Keuls post hoc multiple-comparisons test). p = 0.013, F(2,27) = 5.154. D, Traces represent superimposed average EPSPs in ventral pyramidal cells elicited at Vm = −40 mV in the absence and presence of APV in control cells (left, from experiments shown in Fig. 7B, C) and in the presence of apamin (right). Shading represents SEM. Calibration: 2 mV, 20 ms.
