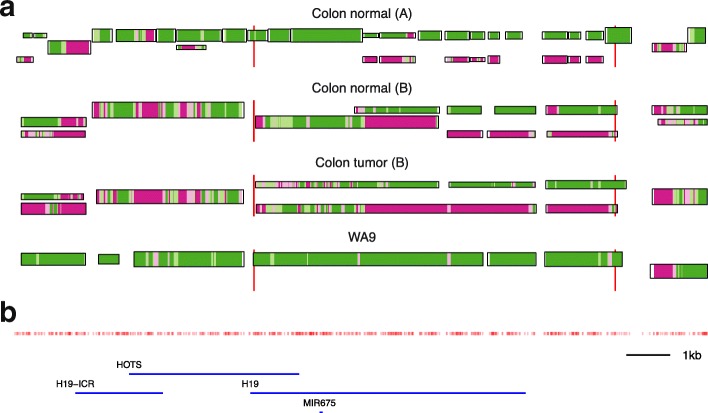
Fig. 4.
Epi-allelic profiling near the H19 gene. Epi-allelic haplotypes of the four samples in a 20-kb region around the H19 gene with one known ASM region (vertical red lines [9]). a Horizontal bars are inferred haplotype chains and the bar thickness represents the average number of reads per position. The average methylation level of three consecutive CpGs in a chain is shown in color, where green is for fully methylated CpG sites, purple for fully unmethylated, and white for neither (the vertical position of a chain represents the average degree of methylation). WA9 has only one (methylated) epi-allele in the entire ASM region, while the other three show one methylated and one unmethylated epi-allele. The unmethylated region does not span the entire ASM region, which is compiled from 22 methylomes from cell lines and tissue samples (not including the colon) [9]. b CpG site density map (red) and known genes (blue). The region ∼2–4 kb upstream of H19 is the H19 imprinting control region (H19-ICR). ASM allele-specific methylation

