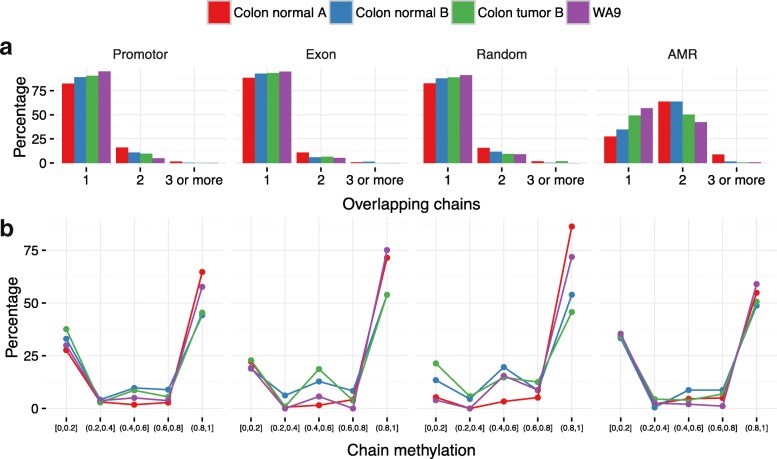
Fig. 5.
Summary statistics of the estimated haplotype chains. Collected statistics of the estimated haplotype chains over four different genomic regions: promoters, exons, randomly selected regions, and known AMRs. For each type, except AMR, 100 regions where randomly chosen. For AMR, 18 known AMRs were used. See Additional file 1: Table S2 and [9]. For each region, haplotypes were estimated using the default configuration and the noise was reduced as described in ‘Noise reduction’ in ‘Results and discussion.’ a The percentage of regions with only one chain, two overlapping chains, and three or more overlapping chains for each region. The majority of regions, except AMRs, were covered by only one chain. b The distribution of the average methylation level over the haplotype chains. Chains tend to be either fully methylated or completely unmethylated. AMR allele-specific methylated region

