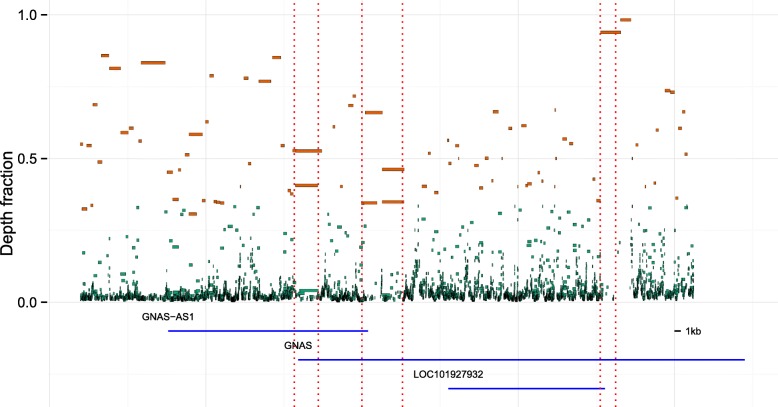
Fig. 9.
Inferred haplotype chains. The plot shows all inferred haplotype chains in a 100-kb region near the GNAS locus in the WA9 sample before noise reduction, as Fig. 3. The depth fraction of a chain is plotted against its genomic position. The color indicates whether the chain is kept (brown) or interpreted as noise (green). See Fig. 8

