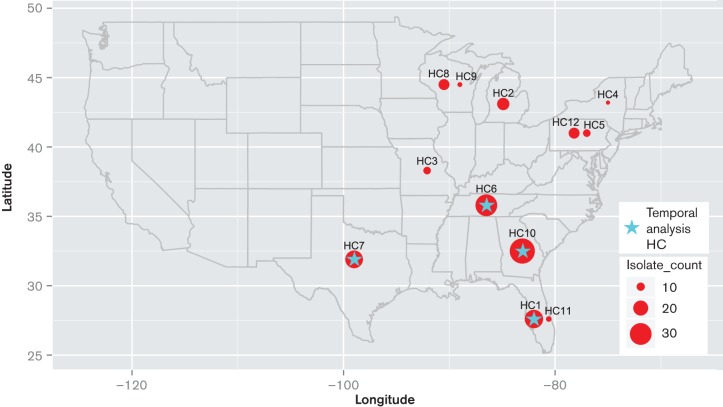
Fig. 1.
Geographic distribution of healthcare centres (HC) that collected isolates analysed in this study. The geographic location on the map represents state coordinates, where the corresponding HC was based. Plots are scaled to represent total number of isolates from corresponding site. HCs that provided isolates used in temporal analyses are marked with a star.

