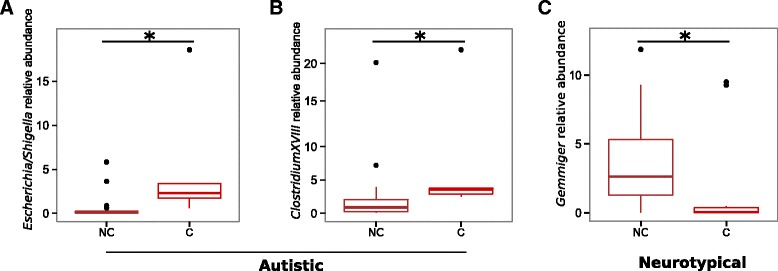
Fig. 4.

Box plot representation of the relative abundances of bacterial genera correlating with the constipation status of the subjects enrolled in this study. Comparisons between a and b constipated (C) and non-constipated (NC) autistic subjects and (c) constipated (C) and non-constipated (NC) neurotypical subjects; Asterisk indicates FDR-corrected p < 0.05, Wilcoxon rank-sum test
