
Fig. 2.
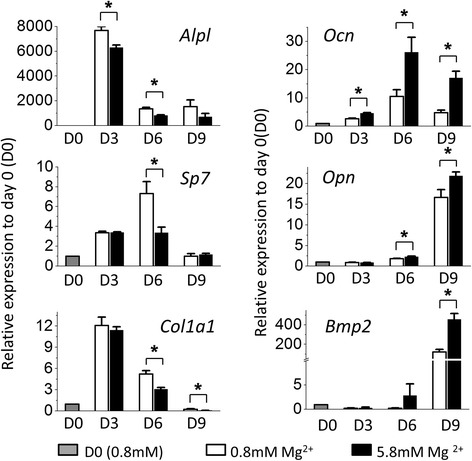
High concentration of extracellular magnesium modulated osteogenic differentiation of mMSCs. qPCR results of mMSCs under osteogenic differentiation for 0, 3, 6, and 9 days (D0, D3, D6, D9) with normal and high extracellular magnesium concentration. Relative gene expression indicates fold-change of gene expression in comparison with gene expression of undifferentiated MSCs on D0 (N = 3, n = 3), presented as mean ± SEM (* p < 0.05)