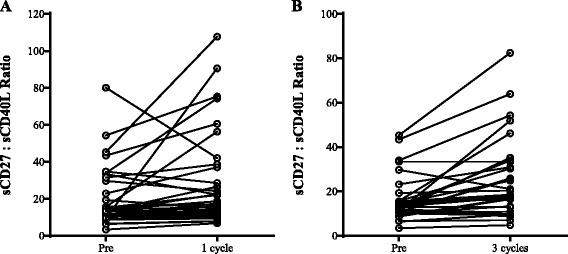
Fig. 7.

Effect of avelumab on soluble factors. Plasma levels of sCD27 and sCD40L were measured at baseline (pre-therapy) and following one cycle (a, n = 39) and three cycles (b, n = 33) of avelumab. Graphs display the ratio of sCD27 to sCD40L. Following one and three cycles of avelumab, there was a statistically significant increase in the ratio (p = 0.0087 and p = 0.0001, respectively, using the Wilcoxon matched-pairs signed rank test)
