Fig. 2.

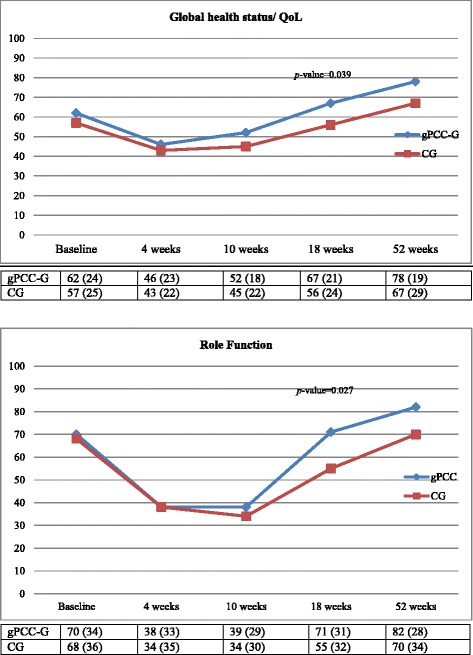
Mean values and standard deviation (SD) of the Global Health status and Role Function (QLQ-30) sub-scores at the five the measurement points, for both groups

Mean values and standard deviation (SD) of the Global Health status and Role Function (QLQ-30) sub-scores at the five the measurement points, for both groups