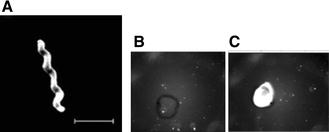
Figure 9.

Visualization and detection of Campylobacter. A Transmission electron microscopy of Campylobacter cell. Bar, 2 µm. B OLED biosensor probing of a negative control sample containing a non-Campylobacter DNA at 12.5 ng/µL, using a probe at 50 ng/µL. The spot was obtained upon deposition of 1 µL of the sample on the sensor surface. C OLED biosensor detection of Campylobacter DNA sequence at 12.5 ng/µL, using 50 ng/µL of the probe. The spot was obtained with 1 µL of the sample as previously explained [125].
